29
/it/
it
AIzaSyAYiBZKx7MnpbEhh9jyipgxe19OcubqV5w
April 1, 2024
272483
Uganda
UGA
true
2
1
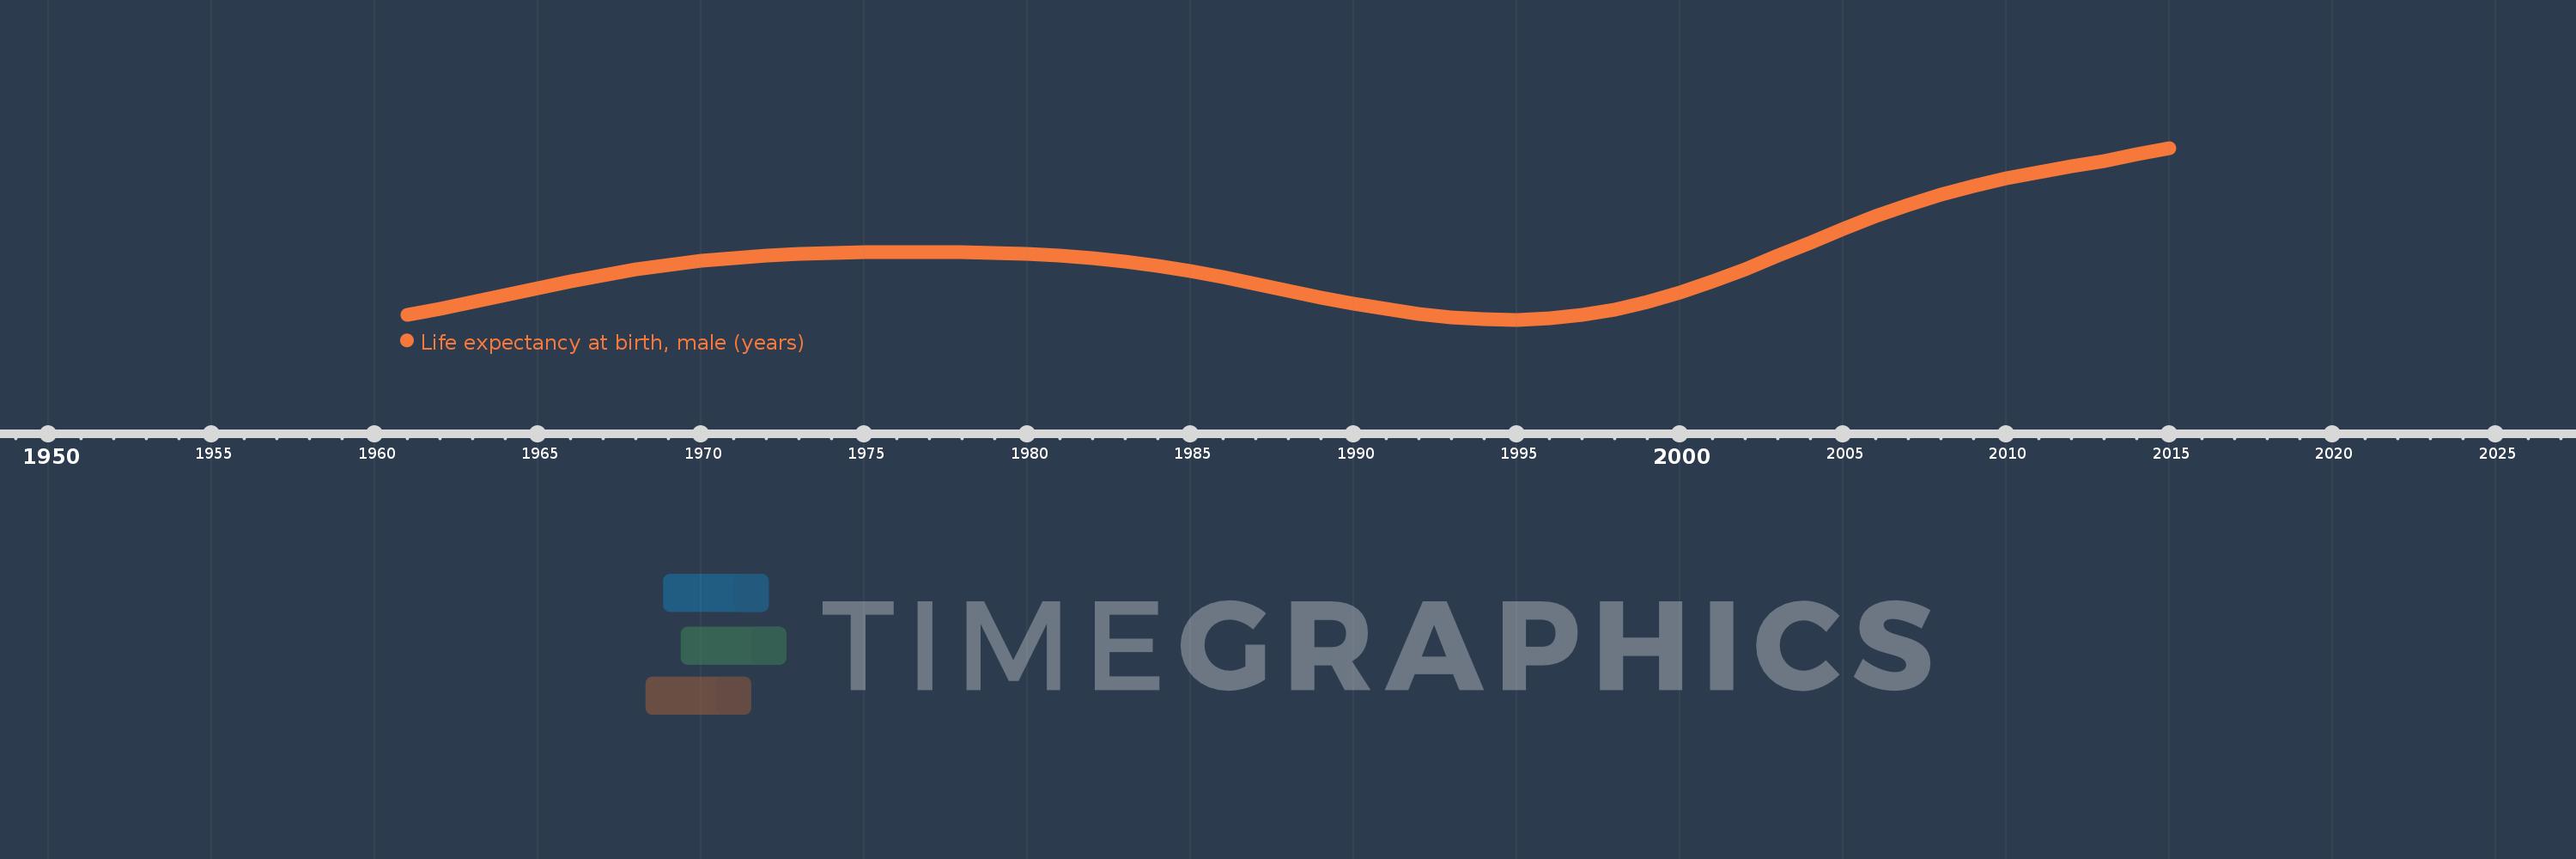
Life expectancy at birth, male (years)
2015,2014,2013,2012,2011,2010,2009,2008,2007,2006,2005,2004,2003,2002,2001,2000,1999,1998,1997,1996,1995,1994,1993,1992,1991,1990,1989,1988,1987,1986,1985,1984,1983,1982,1981,1980,1979,1978,1977,1976,1975,1974,1973,1972,1971,1970,1969,1968,1967,1966,1965,1964,1963,1962,1961
Queste statistiche in altri paesi:
AfghanistanAlbaniaAlgeriaAngolaAntigua and BarbudaArab WorldArgentinaArmeniaArubaAustraliaAustriaAzerbaijanBahamas, TheBahrainBangladeshBarbadosBelarusBelgiumBelizeBeninBermudaBhutanBoliviaBosnia and HerzegovinaBotswanaBrazilBrunei DarussalamBulgariaBurkina FasoBurundiCabo VerdeCambodiaCameroonCanadaCaribbean small statesCentral African RepublicCentral Europe and the BalticsChadChannel IslandsChileChinaColombiaComorosCongo, Dem. Rep.Congo, Rep.Costa RicaCote d'IvoireCroatiaCubaCuracaoCyprusCzech RepublicDenmarkDjiboutiDominicaDominican RepublicEarly-demographic dividendEast Asia & PacificEast Asia & Pacific (excluding high income)East Asia & Pacific (IDA & IBRD countries)EcuadorEgypt, Arab Rep.El SalvadorEquatorial GuineaEritreaEstoniaEthiopiaEuro areaEurope & Central AsiaEurope & Central Asia (excluding high income)Europe & Central Asia (IDA & IBRD countries)European UnionFaroe IslandsFijiFinlandFragile and conflict affected situationsFranceFrench PolynesiaGabonGambia, TheGeorgiaGermanyGhanaGreeceGreenlandGrenadaGuamGuatemalaGuineaGuinea-BissauGuyanaHaitiHeavily indebted poor countries (HIPC)High incomeHondurasHong Kong SAR, ChinaHungaryIBRD onlyIcelandIDA & IBRD totalIDA blendIDA onlyIDA totalIndiaIndonesiaIran, Islamic Rep.IraqIrelandIsle of ManIsraelItalyJamaicaJapanJordanKazakhstanKenyaKiribatiKorea, Dem. People’s Rep.Korea, Rep.KosovoKuwaitKyrgyz RepublicLao PDRLate-demographic dividendLatin America & Caribbean Latin America & Caribbean (excluding high income)Latin America & the Caribbean (IDA & IBRD countries)LatviaLeast developed countries: UN classificationLebanonLesothoLiberiaLibyaLiechtensteinLithuaniaLow & middle incomeLow incomeLower middle incomeLuxembourgMacao SAR, ChinaMacedonia, FYRMadagascarMalawiMalaysiaMaldivesMaliMaltaMarshall IslandsMauritaniaMauritiusMexicoMicronesia, Fed. Sts.Middle East & North AfricaMiddle East & North Africa (excluding high income)Middle East & North Africa (IDA & IBRD countries)Middle incomeMoldovaMongoliaMontenegroMoroccoMozambiqueMyanmarNamibiaNepalNetherlandsNew CaledoniaNew ZealandNicaraguaNigerNigeriaNorth AmericaNorwayOECD membersOmanOther small statesPacific island small statesPakistanPalauPanamaPapua New GuineaParaguayPeruPhilippinesPolandPortugalPost-demographic dividendPre-demographic dividendPuerto RicoQatarRomaniaRussian FederationRwandaSamoaSan MarinoSao Tome and PrincipeSaudi ArabiaSenegalSerbiaSeychellesSierra LeoneSingaporeSint Maarten (Dutch part)Slovak RepublicSloveniaSmall statesSolomon IslandsSomaliaSouth AfricaSouth AsiaSouth Asia (IDA & IBRD)South SudanSpainSri LankaSt. Kitts and NevisSt. LuciaSt. Martin (French part)St. Vincent and the GrenadinesSub-Saharan Africa Sub-Saharan Africa (excluding high income)Sub-Saharan Africa (IDA & IBRD countries)SudanSurinameSwazilandSwedenSwitzerlandSyrian Arab RepublicTajikistanTanzaniaThailandTimor-LesteTogoTongaTrinidad and TobagoTunisiaTurkeyTurkmenistanUgandaUkraineUnited Arab EmiratesUnited KingdomUnited StatesUpper middle incomeUruguayUzbekistanVanuatuVenezuela, RBVietnamVirgin Islands (U.S.)West Bank and GazaWorldYemen, Rep.ZambiaZimbabwe Linea del tempo:
Questa scala temporale mostra un grafico dal 1961 anno al 2015 anno. Uganda. I dati fino ad 1960 anno non disponibili. Il numero di osservazioni attuali secondo i date: 55.
La fonte (nome):
Indicatori dello sviluppo mondiale
La fonte (organizzazione):
(1) United Nations Population Division. World Population Prospects, (2) Census reports and other statistical publications from national statistical offices, (3) Eurostat: Demographic Statistics, (4) United Nations Statistical Division. Population and Vital Statistics Reprot (various years), (5) U.S. Census Bureau: International Database, and (6) Secretariat of the Pacific Community: Statistics and Demography Programme.
Categorie:
Health, Gender, Social Development
sono stati aggiornati
23 apr 2017 anni
Indicatori delle variazioni dei valori per anni
Minima:
42.064
1 gen 1995 anni
Massimo:
56.743
1 gen 2015 anni
Alla data di osservazione
Valore
Variazione assoluta
La variazione rispetto al valore precedente
1 gen 1961 anni
42.446
+42.446
0.0%
1 gen 1962 anni
43.021
+0.575
1.35%
1 gen 1963 anni
43.609
+0.588
1.37%
1 gen 1964 anni
44.203
+0.594
1.36%
1 gen 1965 anni
44.792
+0.589
1.33%
1 gen 1966 anni
45.359
+0.567
1.27%
1 gen 1967 anni
45.885
+0.526
1.16%
1 gen 1968 anni
46.355
+0.47
1.02%
1 gen 1969 anni
46.759
+0.404
0.87%
1 gen 1970 anni
47.091
+0.332
0.71%
1 gen 1971 anni
47.349
+0.258
0.55%
1 gen 1972 anni
47.54
+0.191
0.4%
1 gen 1973 anni
47.678
+0.138
0.29%
1 gen 1974 anni
47.773
+0.095
0.2%
1 gen 1975 anni
47.833
+0.06
0.13%
1 gen 1976 anni
47.863
+0.03
0.06%
1 gen 1977 anni
47.87
+0.007
0.01%
1 gen 1978 anni
47.851
-0.019
-0.04%
1 gen 1979 anni
47.801
-0.05
-0.1%
1 gen 1980 anni
47.714
-0.087
-0.18%
1 gen 1981 anni
47.574
-0.14
-0.29%
1 gen 1982 anni
47.36
-0.214
-0.45%
1 gen 1983 anni
47.063
-0.297
-0.63%
1 gen 1984 anni
46.684
-0.379
-0.81%
1 gen 1985 anni
46.231
-0.453
-0.97%
1 gen 1986 anni
45.715
-0.516
-1.12%
1 gen 1987 anni
45.148
-0.567
-1.24%
1 gen 1988 anni
44.558
-0.59
-1.31%
1 gen 1989 anni
43.978
-0.58
-1.3%
1 gen 1990 anni
43.439
-0.539
-1.23%
1 gen 1991 anni
42.967
-0.472
-1.09%
1 gen 1992 anni
42.581
-0.386
-0.9%
1 gen 1993 anni
42.291
-0.29
-0.68%
1 gen 1994 anni
42.111
-0.18
-0.43%
1 gen 1995 anni
42.064
-0.047
-0.11%
1 gen 1996 anni
42.176
+0.112
0.27%
1 gen 1997 anni
42.474
+0.298
0.71%
1 gen 1998 anni
42.954
+0.48
1.13%
1 gen 1999 anni
43.603
+0.649
1.51%
1 gen 2000 anni
44.404
+0.801
1.84%
1 gen 2001 anni
45.339
+0.935
2.11%
1 gen 2002 anni
46.39
+1.051
2.32%
1 gen 2003 anni
47.519
+1.129
2.43%
1 gen 2004 anni
48.68
+1.161
2.44%
1 gen 2005 anni
49.831
+1.151
2.36%
1 gen 2006 anni
50.919
+1.088
2.18%
1 gen 2007 anni
51.899
+0.98
1.92%
1 gen 2008 anni
52.76
+0.861
1.66%
1 gen 2009 anni
53.501
+0.741
1.4%
1 gen 2010 anni
54.126
+0.625
1.17%
1 gen 2011 anni
54.663
+0.537
0.99%
1 gen 2012 anni
55.154
+0.491
0.9%
1 gen 2013 anni
55.648
+0.494
0.9%
1 gen 2014 anni
56.175
+0.527
0.95%
1 gen 2015 anni
56.743
+0.568
1.01%
Classificazione dei paesi secondo i statistiche attuali per anni


Commenti: