29
/it/
it
AIzaSyAYiBZKx7MnpbEhh9jyipgxe19OcubqV5w
April 1, 2024
78115
Bangladesh
BGD
true
2
1
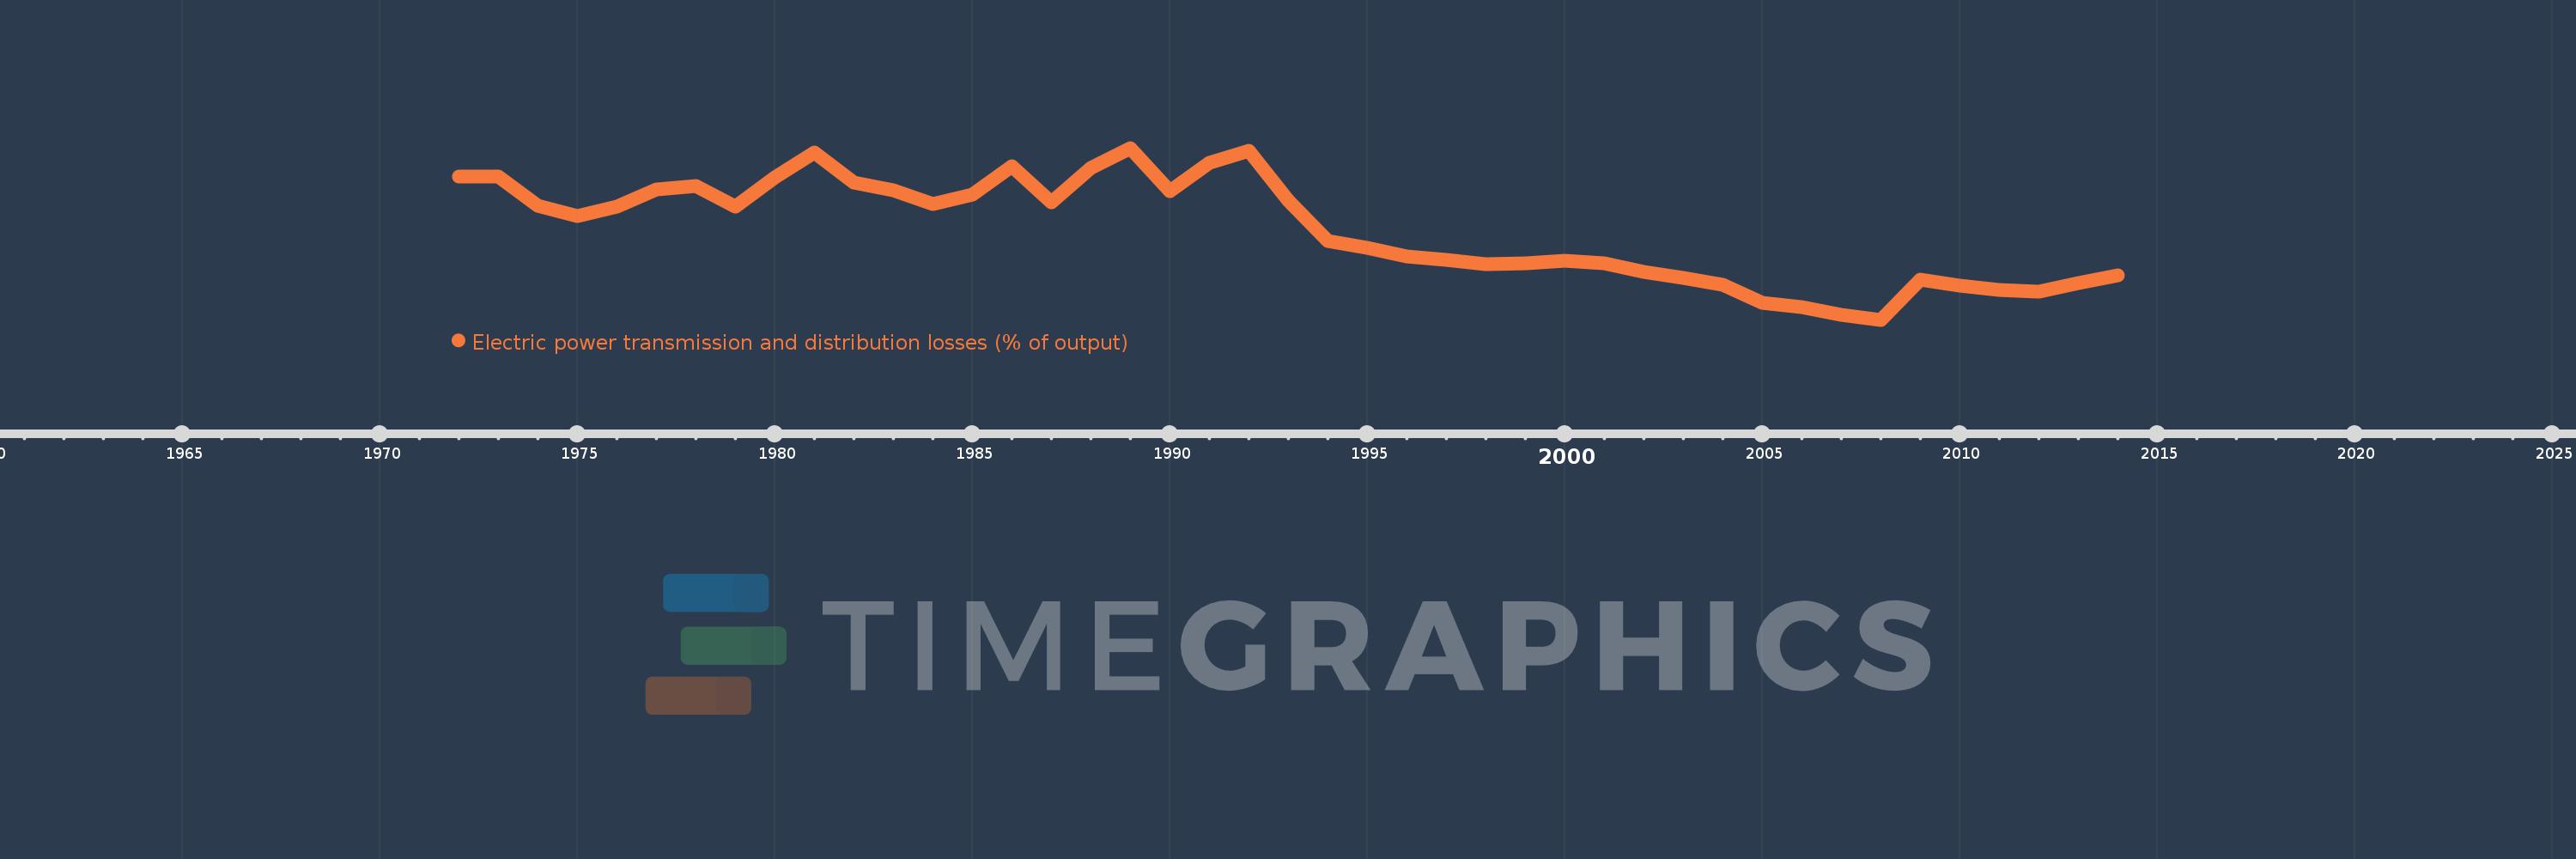
Electric power transmission and distribution losses (% of output)
2014,2013,2012,2011,2010,2009,2008,2007,2006,2005,2004,2003,2002,2001,2000,1999,1998,1997,1996,1995,1994,1993,1992,1991,1990,1989,1988,1987,1986,1985,1984,1983,1982,1981,1980,1979,1978,1977,1976,1975,1974,1973,1972
Queste statistiche in altri paesi:
AlbaniaAlgeriaAngolaArab WorldArgentinaArmeniaAustraliaAustriaAzerbaijanBahrainBangladeshBelarusBelgiumBeninBoliviaBosnia and HerzegovinaBotswanaBrazilBrunei DarussalamBulgariaCambodiaCameroonCanadaCaribbean small statesCentral Europe and the BalticsChileChinaColombiaCongo, Dem. Rep.Congo, Rep.Costa RicaCote d'IvoireCroatiaCubaCuracaoCyprusCzech RepublicDenmarkDominican RepublicEarly-demographic dividendEast Asia & PacificEast Asia & Pacific (excluding high income)East Asia & Pacific (IDA & IBRD countries)EcuadorEgypt, Arab Rep.El SalvadorEritreaEstoniaEthiopiaEuro areaEurope & Central AsiaEurope & Central Asia (excluding high income)Europe & Central Asia (IDA & IBRD countries)European UnionFinlandFragile and conflict affected situationsFranceGabonGeorgiaGermanyGhanaGibraltarGreeceGuatemalaHaitiHeavily indebted poor countries (HIPC)High incomeHondurasHong Kong SAR, ChinaHungaryIBRD onlyIcelandIDA & IBRD totalIDA blendIDA onlyIDA totalIndiaIndonesiaIran, Islamic Rep.IraqIrelandIsraelItalyJamaicaJapanJordanKazakhstanKenyaKorea, Dem. People’s Rep.Korea, Rep.KosovoKuwaitKyrgyz RepublicLate-demographic dividendLatin America & Caribbean Latin America & Caribbean (excluding high income)Latin America & the Caribbean (IDA & IBRD countries)LatviaLeast developed countries: UN classificationLebanonLibyaLithuaniaLow & middle incomeLow incomeLower middle incomeLuxembourgMacedonia, FYRMalaysiaMaltaMauritiusMexicoMiddle East & North AfricaMiddle East & North Africa (excluding high income)Middle East & North Africa (IDA & IBRD countries)Middle incomeMoldovaMongoliaMontenegroMoroccoMozambiqueMyanmarNamibiaNepalNetherlandsNew ZealandNicaraguaNigerNigeriaNorth AmericaNorwayOECD membersOmanOther small statesPakistanPanamaParaguayPeruPhilippinesPolandPortugalPost-demographic dividendPre-demographic dividendQatarRomaniaRussian FederationSaudi ArabiaSenegalSerbiaSingaporeSlovak RepublicSloveniaSmall statesSouth AfricaSouth AsiaSouth Asia (IDA & IBRD)South SudanSpainSri LankaSub-Saharan Africa Sub-Saharan Africa (excluding high income)Sub-Saharan Africa (IDA & IBRD countries)SudanSwedenSwitzerlandSyrian Arab RepublicTajikistanTanzaniaThailandTogoTrinidad and TobagoTunisiaTurkeyTurkmenistanUkraineUnited Arab EmiratesUnited KingdomUnited StatesUpper middle incomeUruguayUzbekistanVenezuela, RBVietnamWorldYemen, Rep.ZambiaZimbabwe Linea del tempo:
Questa scala temporale mostra un grafico dal 1972 anno al 2014 anno. Bangladesh. I dati fino ad 1971 anno non disponibili. Il numero di osservazioni attuali secondo i date: 43.
La fonte (nome):
Indicatori dello sviluppo mondiale
La fonte (organizzazione):
IEA Statistics © OECD/IEA 2014 (http://www.iea.org/stats/index.asp), subject to https://www.iea.org/t&c/termsandconditions/
Categorie:
Energy & Mining, Infrastructure
sono stati aggiornati
23 apr 2017 anni
Indicatori delle variazioni dei valori per anni
Minima:
5.167
1 gen 2008 anni
Massimo:
36.187
1 gen 1989 anni
Alla data di osservazione
Valore
Variazione assoluta
La variazione rispetto al valore precedente
1 gen 1972 anni
31.068
+31.068
0.0%
1 gen 1973 anni
31.068
0.0
0.0%
1 gen 1974 anni
25.783
-5.284
-17.01%
1 gen 1975 anni
23.951
-1.833
-7.11%
1 gen 1976 anni
25.569
+1.618
6.75%
1 gen 1977 anni
28.717
+3.148
12.31%
1 gen 1978 anni
29.317
+0.601
2.09%
1 gen 1979 anni
25.597
-3.72
-12.69%
1 gen 1980 anni
30.849
+5.252
20.52%
1 gen 1981 anni
35.317
+4.467
14.48%
1 gen 1982 anni
29.865
-5.452
-15.44%
1 gen 1983 anni
28.59
-1.275
-4.27%
1 gen 1984 anni
26.1
-2.491
-8.71%
1 gen 1985 anni
27.711
+1.611
6.17%
1 gen 1986 anni
32.84
+5.13
18.51%
1 gen 1987 anni
26.354
-6.486
-19.75%
1 gen 1988 anni
32.54
+6.186
23.47%
1 gen 1989 anni
36.187
+3.647
11.21%
1 gen 1990 anni
28.405
-7.782
-21.51%
1 gen 1991 anni
33.575
+5.17
18.2%
1 gen 1992 anni
35.623
+2.048
6.1%
1 gen 1993 anni
26.658
-8.964
-25.16%
1 gen 1994 anni
19.466
-7.193
-26.98%
1 gen 1995 anni
18.101
-1.365
-7.01%
1 gen 1996 anni
16.62
-1.481
-8.18%
1 gen 1997 anni
15.984
-0.636
-3.83%
1 gen 1998 anni
15.137
-0.847
-5.3%
1 gen 1999 anni
15.417
+0.279
1.85%
1 gen 2000 anni
15.82
+0.403
2.62%
1 gen 2001 anni
15.326
-0.494
-3.13%
1 gen 2002 anni
13.874
-1.451
-9.47%
1 gen 2003 anni
12.708
-1.166
-8.4%
1 gen 2004 anni
11.521
-1.187
-9.34%
1 gen 2005 anni
8.257
-3.264
-28.33%
1 gen 2006 anni
7.434
-0.823
-9.97%
1 gen 2007 anni
6.021
-1.413
-19.01%
1 gen 2008 anni
5.167
-0.854
-14.18%
1 gen 2009 anni
12.482
+7.315
141.57%
1 gen 2010 anni
11.273
-1.209
-9.68%
1 gen 2011 anni
10.542
-0.731
-6.49%
1 gen 2012 anni
10.192
-0.35
-3.32%
1 gen 2013 anni
11.855
+1.663
16.32%
1 gen 2014 anni
13.182
+1.327
11.19%
Classificazione dei paesi secondo i statistiche attuali per anni


Commenti: