29
/it/
it
AIzaSyAYiBZKx7MnpbEhh9jyipgxe19OcubqV5w
April 1, 2024
32517
Europe & Central Asia (IDA & IBRD countries)
TEC
false
2
1
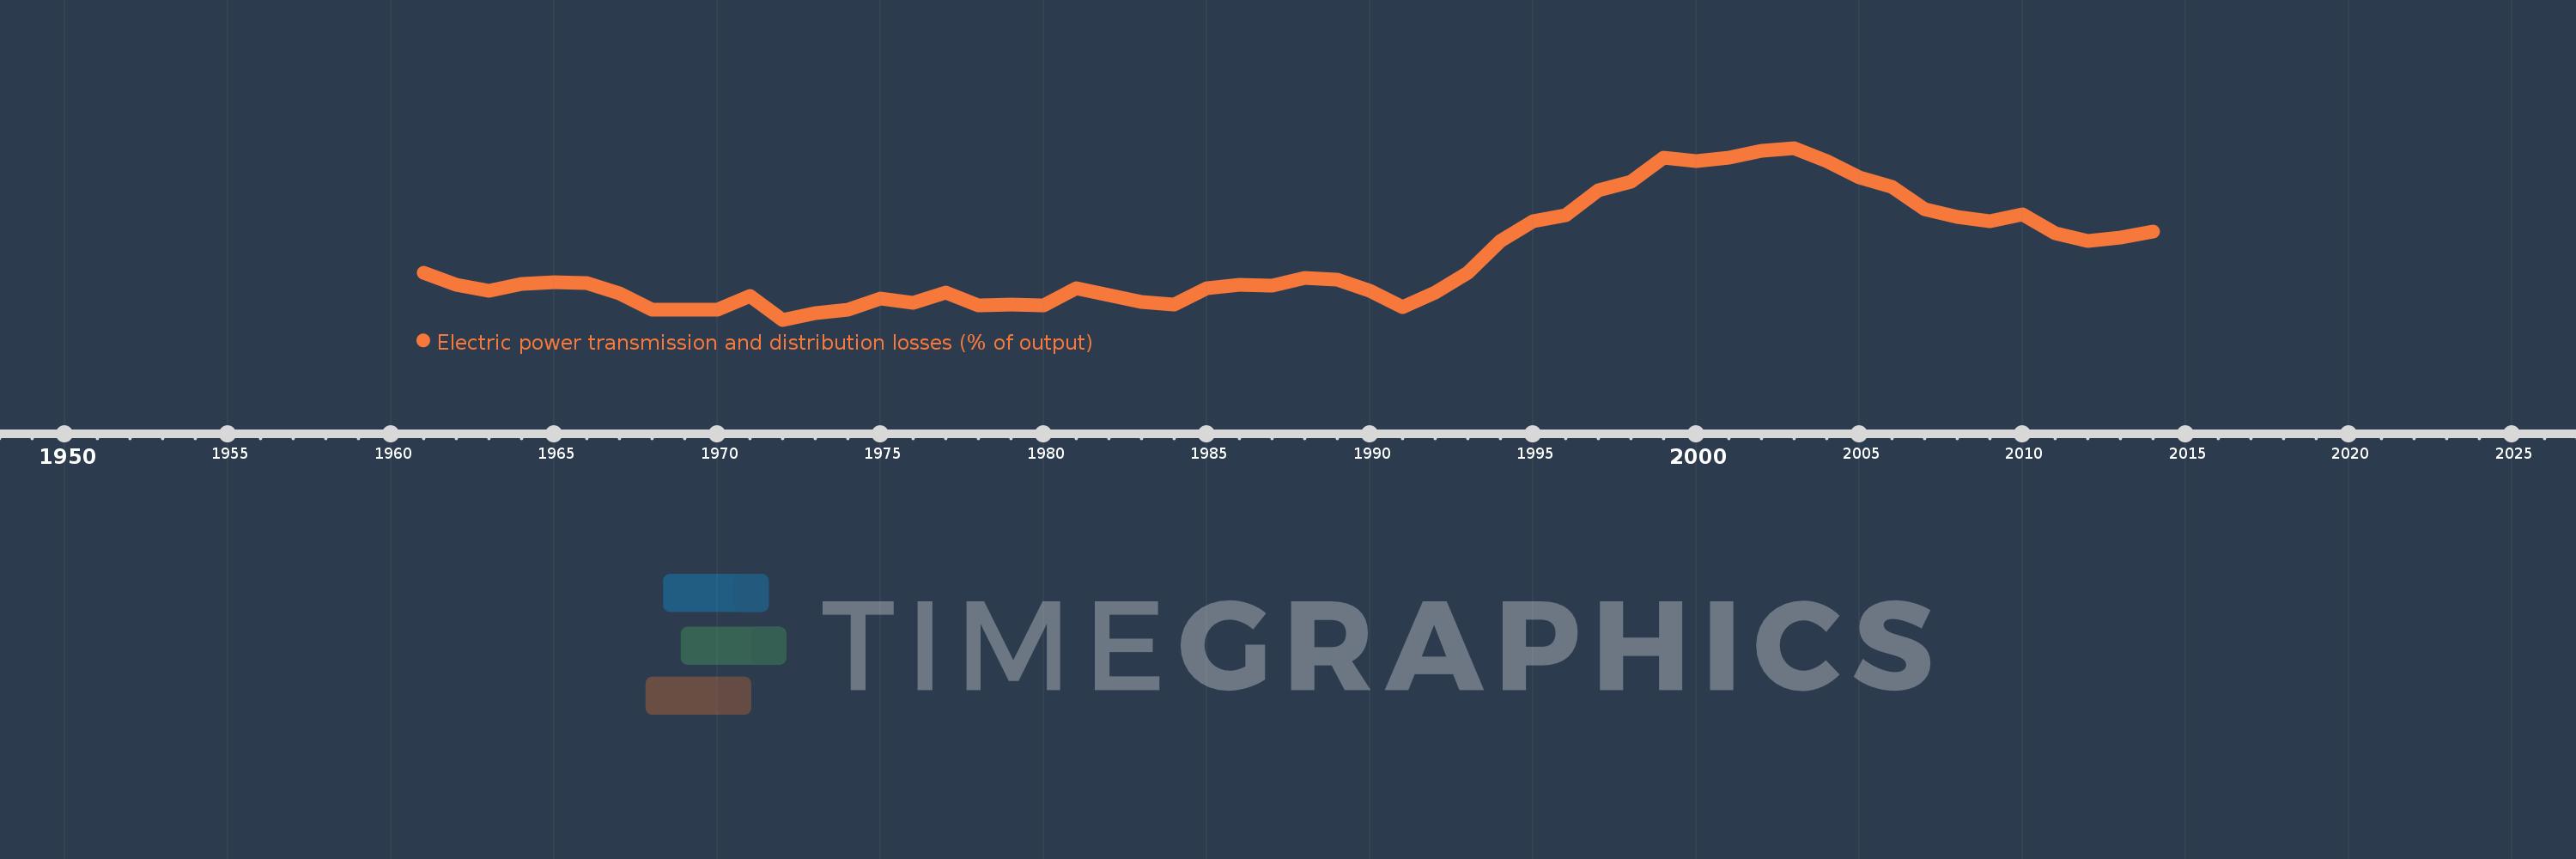
Electric power transmission and distribution losses (% of output)
2014,2013,2012,2011,2010,2009,2008,2007,2006,2005,2004,2003,2002,2001,2000,1999,1998,1997,1996,1995,1994,1993,1992,1991,1990,1989,1988,1987,1986,1985,1984,1983,1982,1981,1980,1979,1978,1977,1976,1975,1974,1973,1972,1971,1970,1969,1968,1967,1966,1965,1964,1963,1962,1961
Queste statistiche in altri paesi:
AlbaniaAlgeriaAngolaArab WorldArgentinaArmeniaAustraliaAustriaAzerbaijanBahrainBangladeshBelarusBelgiumBeninBoliviaBosnia and HerzegovinaBotswanaBrazilBrunei DarussalamBulgariaCambodiaCameroonCanadaCaribbean small statesCentral Europe and the BalticsChileChinaColombiaCongo, Dem. Rep.Congo, Rep.Costa RicaCote d'IvoireCroatiaCubaCuracaoCyprusCzech RepublicDenmarkDominican RepublicEarly-demographic dividendEast Asia & PacificEast Asia & Pacific (excluding high income)East Asia & Pacific (IDA & IBRD countries)EcuadorEgypt, Arab Rep.El SalvadorEritreaEstoniaEthiopiaEuro areaEurope & Central AsiaEurope & Central Asia (excluding high income)Europe & Central Asia (IDA & IBRD countries)European UnionFinlandFragile and conflict affected situationsFranceGabonGeorgiaGermanyGhanaGibraltarGreeceGuatemalaHaitiHeavily indebted poor countries (HIPC)High incomeHondurasHong Kong SAR, ChinaHungaryIBRD onlyIcelandIDA & IBRD totalIDA blendIDA onlyIDA totalIndiaIndonesiaIran, Islamic Rep.IraqIrelandIsraelItalyJamaicaJapanJordanKazakhstanKenyaKorea, Dem. People’s Rep.Korea, Rep.KosovoKuwaitKyrgyz RepublicLate-demographic dividendLatin America & Caribbean Latin America & Caribbean (excluding high income)Latin America & the Caribbean (IDA & IBRD countries)LatviaLeast developed countries: UN classificationLebanonLibyaLithuaniaLow & middle incomeLow incomeLower middle incomeLuxembourgMacedonia, FYRMalaysiaMaltaMauritiusMexicoMiddle East & North AfricaMiddle East & North Africa (excluding high income)Middle East & North Africa (IDA & IBRD countries)Middle incomeMoldovaMongoliaMontenegroMoroccoMozambiqueMyanmarNamibiaNepalNetherlandsNew ZealandNicaraguaNigerNigeriaNorth AmericaNorwayOECD membersOmanOther small statesPakistanPanamaParaguayPeruPhilippinesPolandPortugalPost-demographic dividendPre-demographic dividendQatarRomaniaRussian FederationSaudi ArabiaSenegalSerbiaSingaporeSlovak RepublicSloveniaSmall statesSouth AfricaSouth AsiaSouth Asia (IDA & IBRD)South SudanSpainSri LankaSub-Saharan Africa Sub-Saharan Africa (excluding high income)Sub-Saharan Africa (IDA & IBRD countries)SudanSwedenSwitzerlandSyrian Arab RepublicTajikistanTanzaniaThailandTogoTrinidad and TobagoTunisiaTurkeyTurkmenistanUkraineUnited Arab EmiratesUnited KingdomUnited StatesUpper middle incomeUruguayUzbekistanVenezuela, RBVietnamWorldYemen, Rep.ZambiaZimbabwe Linea del tempo:
Questa scala temporale mostra un grafico dal 1961 anno al 2014 anno. Europe & Central Asia (IDA & IBRD countries). I dati fino ad 1960 anno non disponibili. Il numero di osservazioni attuali secondo i date: 54.
La fonte (nome):
Indicatori dello sviluppo mondiale
La fonte (organizzazione):
IEA Statistics © OECD/IEA 2014 (http://www.iea.org/stats/index.asp), subject to https://www.iea.org/t&c/termsandconditions/
Categorie:
Energy & Mining, Infrastructure
sono stati aggiornati
23 apr 2017 anni
Indicatori delle variazioni dei valori per anni
Minima:
8.019
1 gen 1972 anni
Massimo:
13.732
1 gen 2003 anni
Alla data di osservazione
Valore
Variazione assoluta
La variazione rispetto al valore precedente
1 gen 1961 anni
9.593
+9.593
0.0%
1 gen 1962 anni
9.188
-0.404
-4.22%
1 gen 1963 anni
8.976
-0.212
-2.31%
1 gen 1964 anni
9.224
+0.248
2.76%
1 gen 1965 anni
9.256
+0.032
0.34%
1 gen 1966 anni
9.251
-0.005
-0.05%
1 gen 1967 anni
8.889
-0.362
-3.91%
1 gen 1968 anni
8.339
-0.551
-6.2%
1 gen 1969 anni
8.339
+0.0
0.0%
1 gen 1970 anni
8.34
+0.001
0.01%
1 gen 1971 anni
8.809
+0.469
5.62%
1 gen 1972 anni
8.019
-0.79
-8.97%
1 gen 1973 anni
8.251
+0.232
2.89%
1 gen 1974 anni
8.358
+0.107
1.3%
1 gen 1975 anni
8.732
+0.374
4.48%
1 gen 1976 anni
8.587
-0.145
-1.66%
1 gen 1977 anni
8.937
+0.349
4.07%
1 gen 1978 anni
8.503
-0.434
-4.85%
1 gen 1979 anni
8.534
+0.031
0.37%
1 gen 1980 anni
8.494
-0.04
-0.47%
1 gen 1981 anni
9.055
+0.561
6.6%
1 gen 1982 anni
8.853
-0.202
-2.23%
1 gen 1983 anni
8.611
-0.242
-2.74%
1 gen 1984 anni
8.512
-0.098
-1.14%
1 gen 1985 anni
9.057
+0.544
6.39%
1 gen 1986 anni
9.172
+0.115
1.27%
1 gen 1987 anni
9.148
-0.024
-0.26%
1 gen 1988 anni
9.397
+0.249
2.72%
1 gen 1989 anni
9.365
-0.032
-0.34%
1 gen 1990 anni
8.982
-0.384
-4.1%
1 gen 1991 anni
8.447
-0.534
-5.95%
1 gen 1992 anni
8.921
+0.473
5.6%
1 gen 1993 anni
9.573
+0.652
7.31%
1 gen 1994 anni
10.626
+1.053
11.0%
1 gen 1995 anni
11.307
+0.681
6.41%
1 gen 1996 anni
11.505
+0.198
1.75%
1 gen 1997 anni
12.326
+0.821
7.14%
1 gen 1998 anni
12.606
+0.28
2.27%
1 gen 1999 anni
13.414
+0.808
6.41%
1 gen 2000 anni
13.297
-0.117
-0.87%
1 gen 2001 anni
13.403
+0.106
0.8%
1 gen 2002 anni
13.646
+0.243
1.81%
1 gen 2003 anni
13.732
+0.086
0.63%
1 gen 2004 anni
13.3
-0.432
-3.15%
1 gen 2005 anni
12.764
-0.536
-4.03%
1 gen 2006 anni
12.443
-0.321
-2.51%
1 gen 2007 anni
11.708
-0.735
-5.9%
1 gen 2008 anni
11.43
-0.278
-2.38%
1 gen 2009 anni
11.283
-0.147
-1.28%
1 gen 2010 anni
11.528
+0.245
2.17%
1 gen 2011 anni
10.897
-0.632
-5.48%
1 gen 2012 anni
10.648
-0.248
-2.28%
1 gen 2013 anni
10.759
+0.111
1.04%
1 gen 2014 anni
10.94
+0.18
1.68%
Classificazione dei paesi secondo i statistiche attuali per anni


Commenti: