29
/it/
it
AIzaSyAYiBZKx7MnpbEhh9jyipgxe19OcubqV5w
April 1, 2024
74436
Austria
AUT
true
2
1
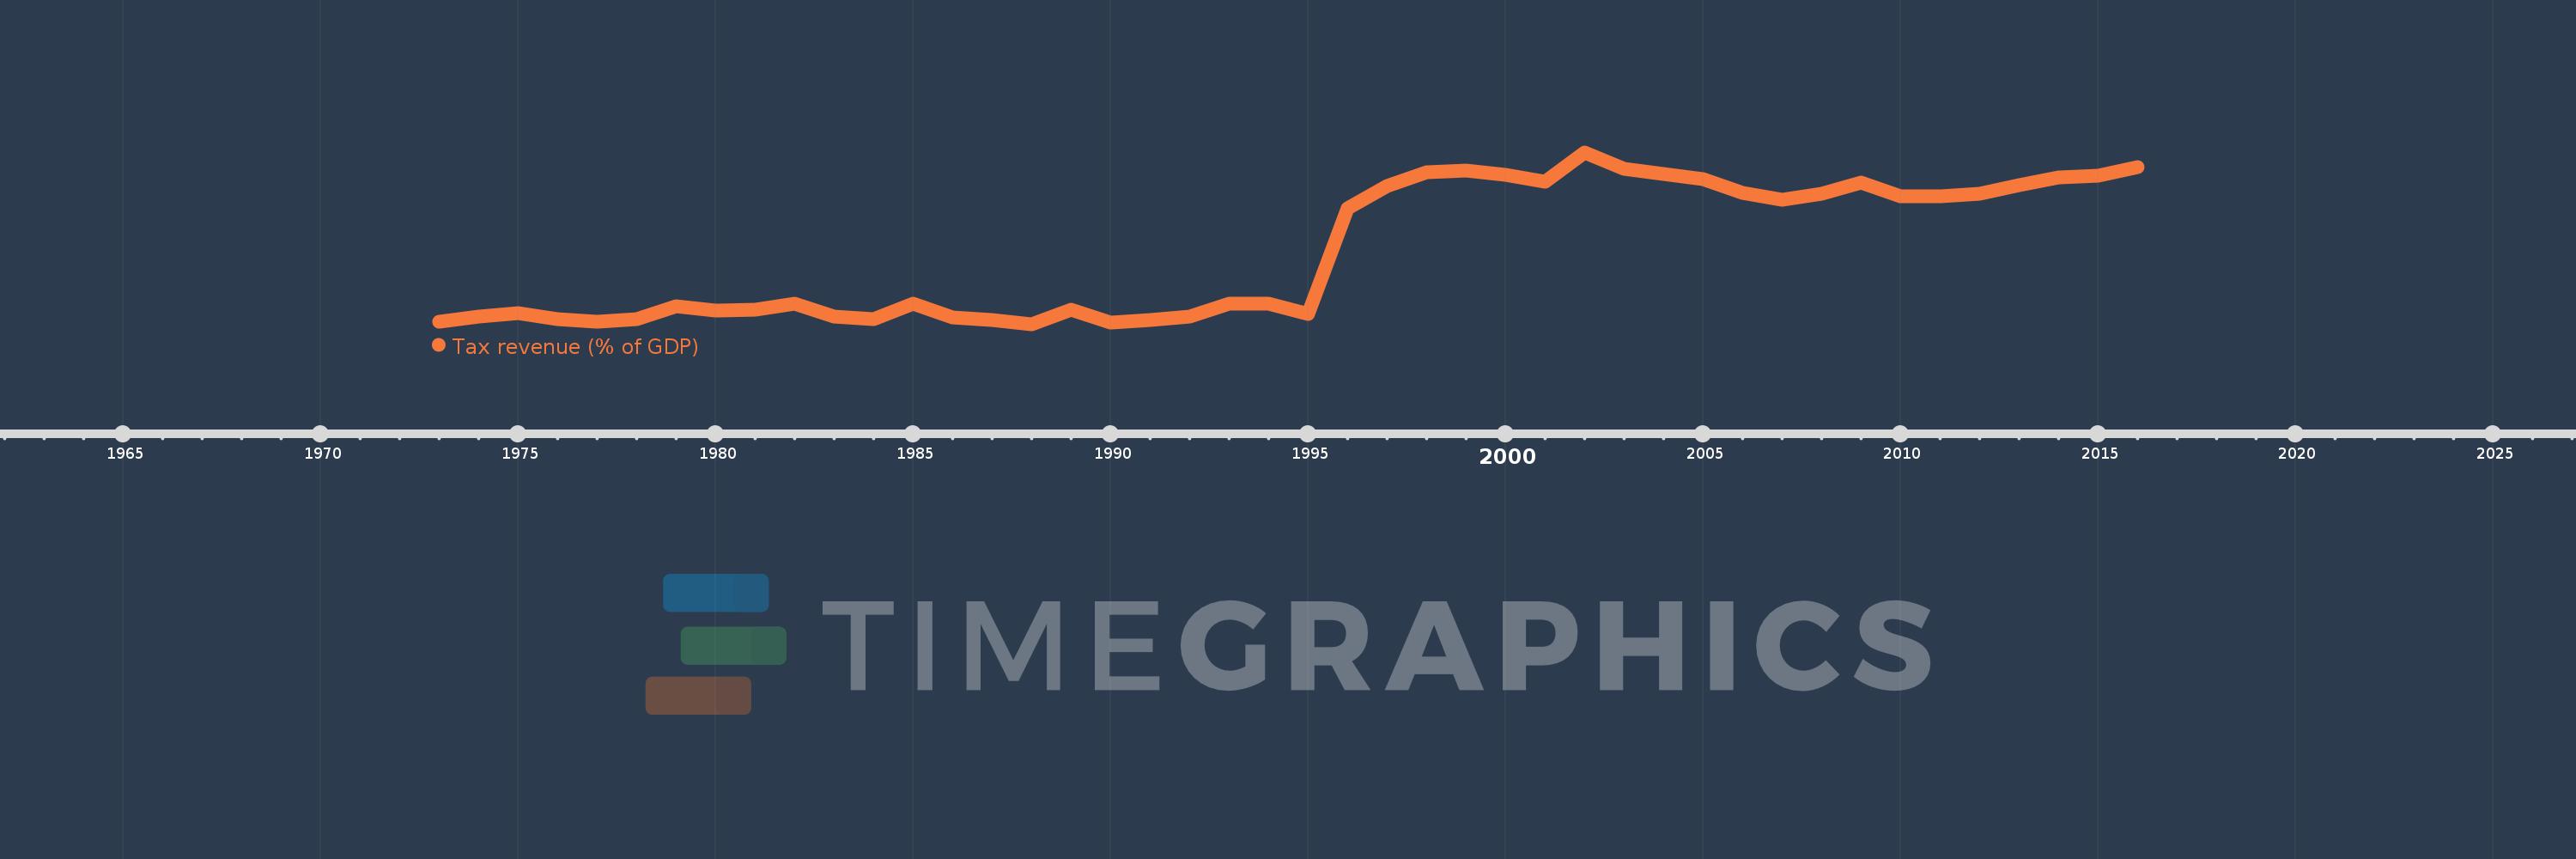
Tax revenue (% of GDP)
2016,2015,2014,2013,2012,2011,2010,2009,2008,2007,2006,2005,2004,2003,2002,2001,2000,1999,1998,1997,1996,1995,1994,1993,1992,1991,1990,1989,1988,1987,1986,1985,1984,1983,1982,1981,1980,1979,1978,1977,1976,1975,1974,1973
Queste statistiche in altri paesi:
AfghanistanAlbaniaAlgeriaAngolaAntigua and BarbudaArgentinaArmeniaAustraliaAustriaAzerbaijanBahamas, TheBahrainBangladeshBarbadosBelarusBelgiumBelizeBeninBhutanBoliviaBosnia and HerzegovinaBotswanaBrazilBulgariaBurkina FasoBurundiCabo VerdeCambodiaCanadaCaribbean small statesCentral African RepublicCentral Europe and the BalticsChileChinaColombiaCongo, Dem. Rep.Congo, Rep.Costa RicaCote d'IvoireCroatiaCyprusCzech RepublicDenmarkDominicaDominican RepublicEarly-demographic dividendEast Asia & PacificEast Asia & Pacific (excluding high income)East Asia & Pacific (IDA & IBRD countries)Egypt, Arab Rep.El SalvadorEquatorial GuineaEstoniaEthiopiaEuro areaEurope & Central AsiaEurope & Central Asia (excluding high income)Europe & Central Asia (IDA & IBRD countries)European UnionFijiFinlandFranceGambia, TheGeorgiaGermanyGhanaGreeceGrenadaGuatemalaHeavily indebted poor countries (HIPC)High incomeHondurasHong Kong SAR, ChinaHungaryIBRD onlyIcelandIDA & IBRD totalIDA blendIDA onlyIDA totalIndiaIndonesiaIran, Islamic Rep.IraqIrelandIsraelItalyJamaicaJapanJordanKazakhstanKenyaKiribatiKorea, Rep.KuwaitKyrgyz RepublicLao PDRLate-demographic dividendLatin America & Caribbean Latin America & Caribbean (excluding high income)Latin America & the Caribbean (IDA & IBRD countries)LatviaLeast developed countries: UN classificationLebanonLesothoLiberiaLithuaniaLow & middle incomeLow incomeLower middle incomeLuxembourgMacao SAR, ChinaMacedonia, FYRMadagascarMalawiMalaysiaMaldivesMaliMaltaMauritiusMexicoMicronesia, Fed. Sts.Middle East & North Africa (excluding high income)Middle East & North Africa (IDA & IBRD countries)Middle incomeMoldovaMongoliaMoroccoMozambiqueMyanmarNamibiaNepalNetherlandsNew ZealandNicaraguaNigeriaNorth AmericaNorwayOECD membersOmanOther small statesPacific island small statesPakistanPanamaPapua New GuineaParaguayPeruPhilippinesPolandPortugalPost-demographic dividendPre-demographic dividendQatarRomaniaRussian FederationRwandaSamoaSan MarinoSao Tome and PrincipeSenegalSerbiaSeychellesSierra LeoneSingaporeSlovak RepublicSloveniaSmall statesSolomon IslandsSouth AfricaSouth AsiaSouth Asia (IDA & IBRD)SpainSri LankaSt. Kitts and NevisSt. LuciaSt. Vincent and the GrenadinesSub-Saharan Africa Sub-Saharan Africa (excluding high income)Sub-Saharan Africa (IDA & IBRD countries)SurinameSwazilandSwedenSwitzerlandSyrian Arab RepublicTajikistanTanzaniaThailandTimor-LesteTogoTrinidad and TobagoTunisiaTurkeyUgandaUkraineUnited Arab EmiratesUnited KingdomUnited StatesUpper middle incomeUruguayVanuatuVenezuela, RBVietnamWest Bank and GazaWorldYemen, Rep.ZambiaZimbabwe Linea del tempo:
Questa scala temporale mostra un grafico dal 1973 anno al 2016 anno. Austria. I dati fino ad 1972 anno non disponibili. Il numero di osservazioni attuali secondo i date: 44.
La fonte (nome):
Indicatori dello sviluppo mondiale
La fonte (organizzazione):
International Monetary Fund, Government Finance Statistics Yearbook and data files, and World Bank and OECD GDP estimates.
Categorie:
Public Sector
sono stati aggiornati
23 apr 2017 anni
Indicatori delle variazioni dei valori per anni
Minima:
17.763
1 gen 1988 anni
Massimo:
28.02
1 gen 2002 anni
Alla data di osservazione
Valore
Variazione assoluta
La variazione rispetto al valore precedente
1 gen 1973 anni
17.932
+17.932
0.0%
1 gen 1974 anni
18.241
+0.309
1.72%
1 gen 1975 anni
18.442
+0.201
1.1%
1 gen 1976 anni
18.054
-0.387
-2.1%
1 gen 1977 anni
17.905
-0.149
-0.83%
1 gen 1978 anni
18.043
+0.137
0.77%
1 gen 1979 anni
18.823
+0.78
4.32%
1 gen 1980 anni
18.595
-0.228
-1.21%
1 gen 1981 anni
18.623
+0.028
0.15%
1 gen 1982 anni
18.996
+0.373
2.0%
1 gen 1983 anni
18.234
-0.761
-4.01%
1 gen 1984 anni
18.076
-0.158
-0.87%
1 gen 1985 anni
19.01
+0.934
5.17%
1 gen 1986 anni
18.148
-0.862
-4.54%
1 gen 1987 anni
18.016
-0.132
-0.73%
1 gen 1988 anni
17.763
-0.253
-1.4%
1 gen 1989 anni
18.608
+0.845
4.76%
1 gen 1990 anni
17.849
-0.759
-4.08%
1 gen 1991 anni
18.025
+0.176
0.98%
1 gen 1992 anni
18.211
+0.187
1.03%
1 gen 1993 anni
18.966
+0.755
4.15%
1 gen 1994 anni
18.981
+0.015
0.08%
1 gen 1995 anni
18.39
-0.591
-3.12%
1 gen 1996 anni
24.66
+6.27
34.09%
1 gen 1997 anni
25.998
+1.339
5.43%
1 gen 1998 anni
26.857
+0.858
3.3%
1 gen 1999 anni
26.961
+0.104
0.39%
1 gen 2000 anni
26.684
-0.277
-1.03%
1 gen 2001 anni
26.276
-0.409
-1.53%
1 gen 2002 anni
28.02
+1.745
6.64%
1 gen 2003 anni
27.027
-0.993
-3.54%
1 gen 2004 anni
26.747
-0.281
-1.04%
1 gen 2005 anni
26.401
-0.346
-1.29%
1 gen 2006 anni
25.621
-0.779
-2.95%
1 gen 2007 anni
25.177
-0.444
-1.73%
1 gen 2008 anni
25.539
+0.362
1.44%
1 gen 2009 anni
26.241
+0.702
2.75%
1 gen 2010 anni
25.389
-0.852
-3.25%
1 gen 2011 anni
25.391
+0.002
0.01%
1 gen 2012 anni
25.551
+0.161
0.63%
1 gen 2013 anni
26.054
+0.502
1.97%
1 gen 2014 anni
26.527
+0.474
1.82%
1 gen 2015 anni
26.636
+0.109
0.41%
1 gen 2016 anni
27.147
+0.511
1.92%
Classificazione dei paesi secondo i statistiche attuali per anni


Commenti: