29
/it/
it
AIzaSyAYiBZKx7MnpbEhh9jyipgxe19OcubqV5w
April 1, 2024
165599
Jordan
JOR
true
2
1
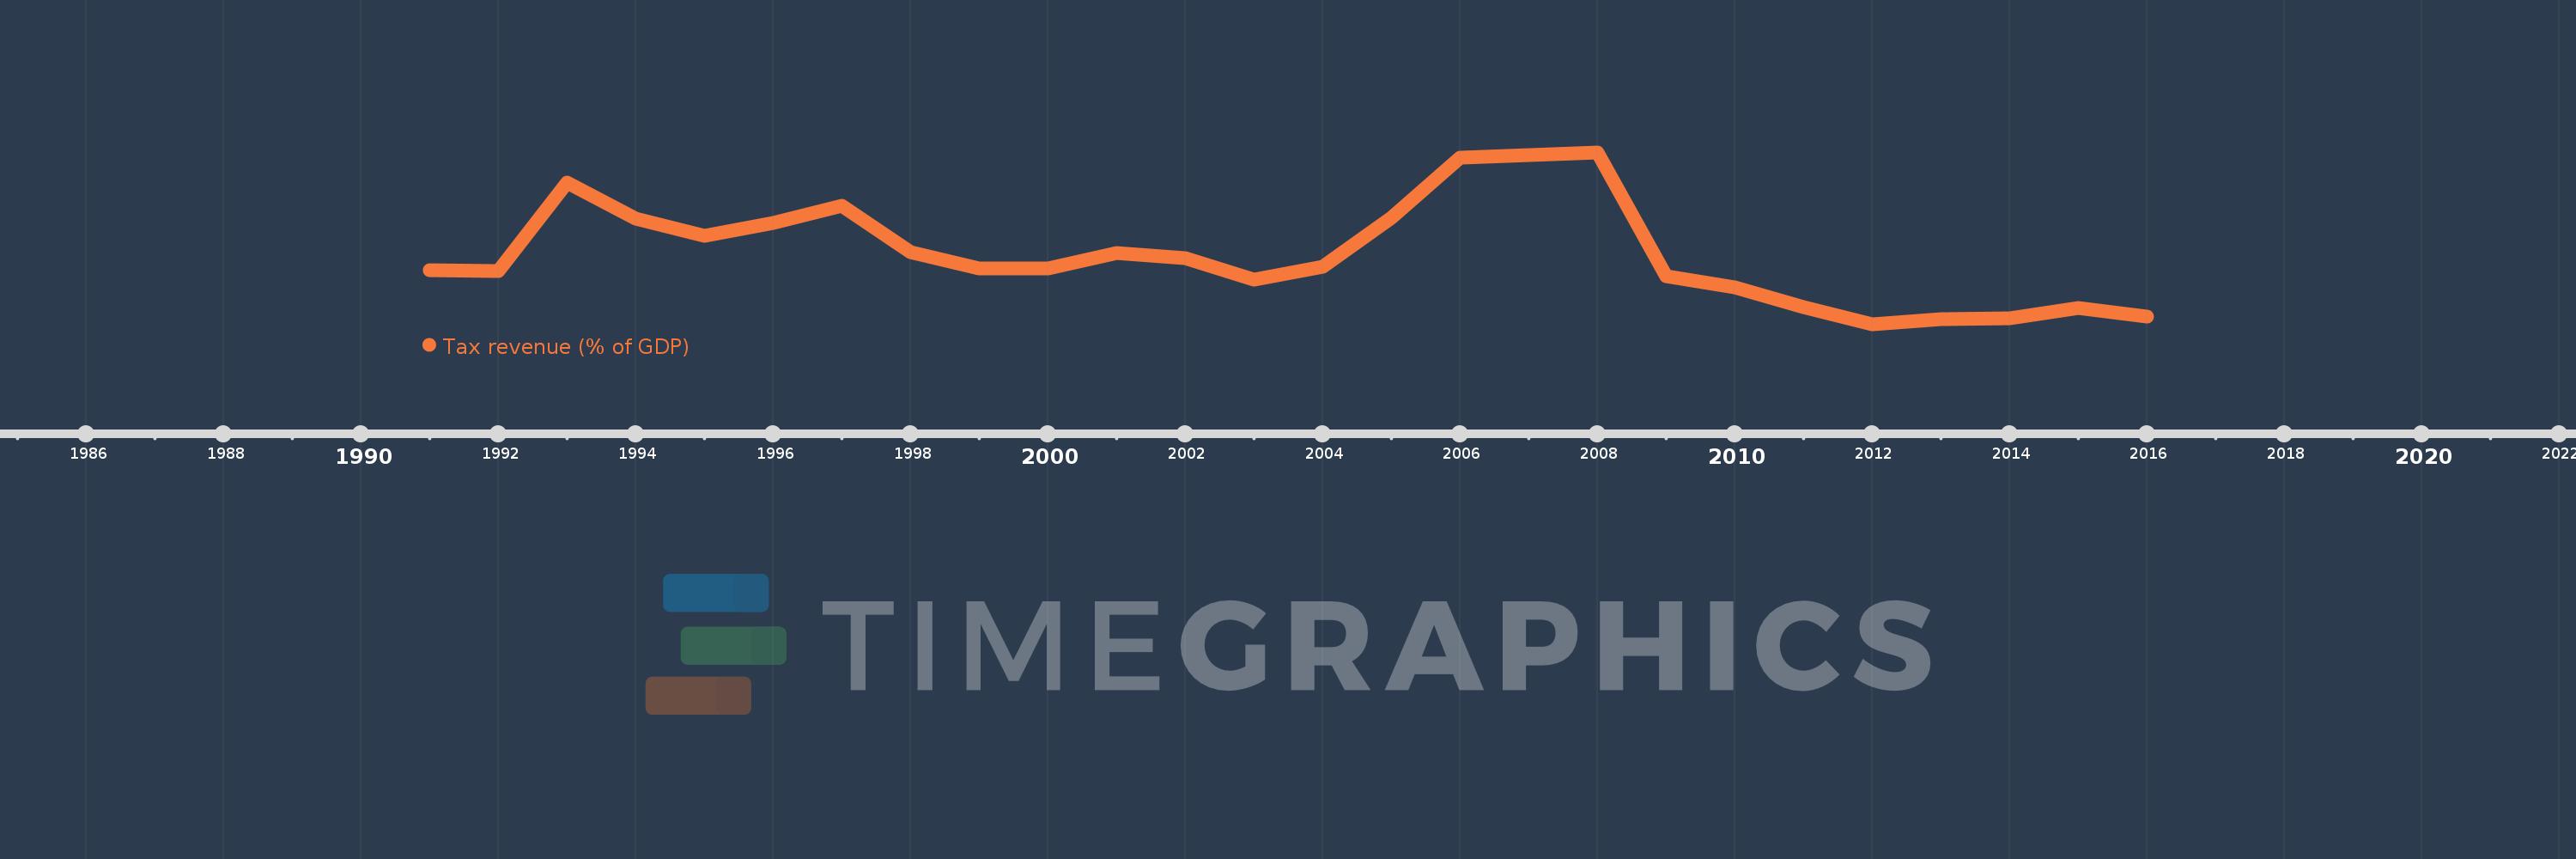
Tax revenue (% of GDP)
2016,2015,2014,2013,2012,2011,2010,2009,2008,2007,2006,2005,2004,2003,2002,2001,2000,1999,1998,1997,1996,1995,1994,1993,1992,1991
Queste statistiche in altri paesi:
AfghanistanAlbaniaAlgeriaAngolaAntigua and BarbudaArgentinaArmeniaAustraliaAustriaAzerbaijanBahamas, TheBahrainBangladeshBarbadosBelarusBelgiumBelizeBeninBhutanBoliviaBosnia and HerzegovinaBotswanaBrazilBulgariaBurkina FasoBurundiCabo VerdeCambodiaCanadaCaribbean small statesCentral African RepublicCentral Europe and the BalticsChileChinaColombiaCongo, Dem. Rep.Congo, Rep.Costa RicaCote d'IvoireCroatiaCyprusCzech RepublicDenmarkDominicaDominican RepublicEarly-demographic dividendEast Asia & PacificEast Asia & Pacific (excluding high income)East Asia & Pacific (IDA & IBRD countries)Egypt, Arab Rep.El SalvadorEquatorial GuineaEstoniaEthiopiaEuro areaEurope & Central AsiaEurope & Central Asia (excluding high income)Europe & Central Asia (IDA & IBRD countries)European UnionFijiFinlandFranceGambia, TheGeorgiaGermanyGhanaGreeceGrenadaGuatemalaHeavily indebted poor countries (HIPC)High incomeHondurasHong Kong SAR, ChinaHungaryIBRD onlyIcelandIDA & IBRD totalIDA blendIDA onlyIDA totalIndiaIndonesiaIran, Islamic Rep.IraqIrelandIsraelItalyJamaicaJapanJordanKazakhstanKenyaKiribatiKorea, Rep.KuwaitKyrgyz RepublicLao PDRLate-demographic dividendLatin America & Caribbean Latin America & Caribbean (excluding high income)Latin America & the Caribbean (IDA & IBRD countries)LatviaLeast developed countries: UN classificationLebanonLesothoLiberiaLithuaniaLow & middle incomeLow incomeLower middle incomeLuxembourgMacao SAR, ChinaMacedonia, FYRMadagascarMalawiMalaysiaMaldivesMaliMaltaMauritiusMexicoMicronesia, Fed. Sts.Middle East & North Africa (excluding high income)Middle East & North Africa (IDA & IBRD countries)Middle incomeMoldovaMongoliaMoroccoMozambiqueMyanmarNamibiaNepalNetherlandsNew ZealandNicaraguaNigeriaNorth AmericaNorwayOECD membersOmanOther small statesPacific island small statesPakistanPanamaPapua New GuineaParaguayPeruPhilippinesPolandPortugalPost-demographic dividendPre-demographic dividendQatarRomaniaRussian FederationRwandaSamoaSan MarinoSao Tome and PrincipeSenegalSerbiaSeychellesSierra LeoneSingaporeSlovak RepublicSloveniaSmall statesSolomon IslandsSouth AfricaSouth AsiaSouth Asia (IDA & IBRD)SpainSri LankaSt. Kitts and NevisSt. LuciaSt. Vincent and the GrenadinesSub-Saharan Africa Sub-Saharan Africa (excluding high income)Sub-Saharan Africa (IDA & IBRD countries)SurinameSwazilandSwedenSwitzerlandSyrian Arab RepublicTajikistanTanzaniaThailandTimor-LesteTogoTrinidad and TobagoTunisiaTurkeyUgandaUkraineUnited Arab EmiratesUnited KingdomUnited StatesUpper middle incomeUruguayVanuatuVenezuela, RBVietnamWest Bank and GazaWorldYemen, Rep.ZambiaZimbabwe Linea del tempo:
Questa scala temporale mostra un grafico dal 1991 anno al 2016 anno. Jordan. I dati fino ad 1990 anno non disponibili. Il numero di osservazioni attuali secondo i date: 26.
La fonte (nome):
Indicatori dello sviluppo mondiale
La fonte (organizzazione):
International Monetary Fund, Government Finance Statistics Yearbook and data files, and World Bank and OECD GDP estimates.
Categorie:
Public Sector
sono stati aggiornati
23 apr 2017 anni
Indicatori delle variazioni dei valori per anni
Minima:
14.955
1 gen 2012 anni
Massimo:
24.69
1 gen 2008 anni
Alla data di osservazione
Valore
Variazione assoluta
La variazione rispetto al valore precedente
1 gen 1991 anni
18.007
+18.007
0.0%
1 gen 1992 anni
17.95
-0.057
-0.32%
1 gen 1993 anni
22.971
+5.021
27.97%
1 gen 1994 anni
20.917
-2.054
-8.94%
1 gen 1995 anni
19.986
-0.931
-4.45%
1 gen 1996 anni
20.709
+0.723
3.62%
1 gen 1997 anni
21.687
+0.978
4.72%
1 gen 1998 anni
19.06
-2.627
-12.12%
1 gen 1999 anni
18.127
-0.932
-4.89%
1 gen 2000 anni
18.114
-0.013
-0.07%
1 gen 2001 anni
19.005
+0.89
4.92%
1 gen 2002 anni
18.685
-0.319
-1.68%
1 gen 2003 anni
17.485
-1.2
-6.42%
1 gen 2004 anni
18.222
+0.737
4.21%
1 gen 2005 anni
21.003
+2.781
15.26%
1 gen 2006 anni
24.416
+3.413
16.25%
1 gen 2007 anni
24.555
+0.139
0.57%
1 gen 2008 anni
24.69
+0.135
0.55%
1 gen 2009 anni
17.688
-7.002
-28.36%
1 gen 2010 anni
17.03
-0.658
-3.72%
1 gen 2011 anni
15.915
-1.115
-6.55%
1 gen 2012 anni
14.955
-0.96
-6.03%
1 gen 2013 anni
15.258
+0.303
2.03%
1 gen 2014 anni
15.313
+0.055
0.36%
1 gen 2015 anni
15.871
+0.558
3.65%
1 gen 2016 anni
15.377
-0.494
-3.11%
Classificazione dei paesi secondo i statistiche attuali per anni


Commenti: