29
/it/
it
AIzaSyAYiBZKx7MnpbEhh9jyipgxe19OcubqV5w
April 1, 2024
73022
Australia
AUS
true
2
1
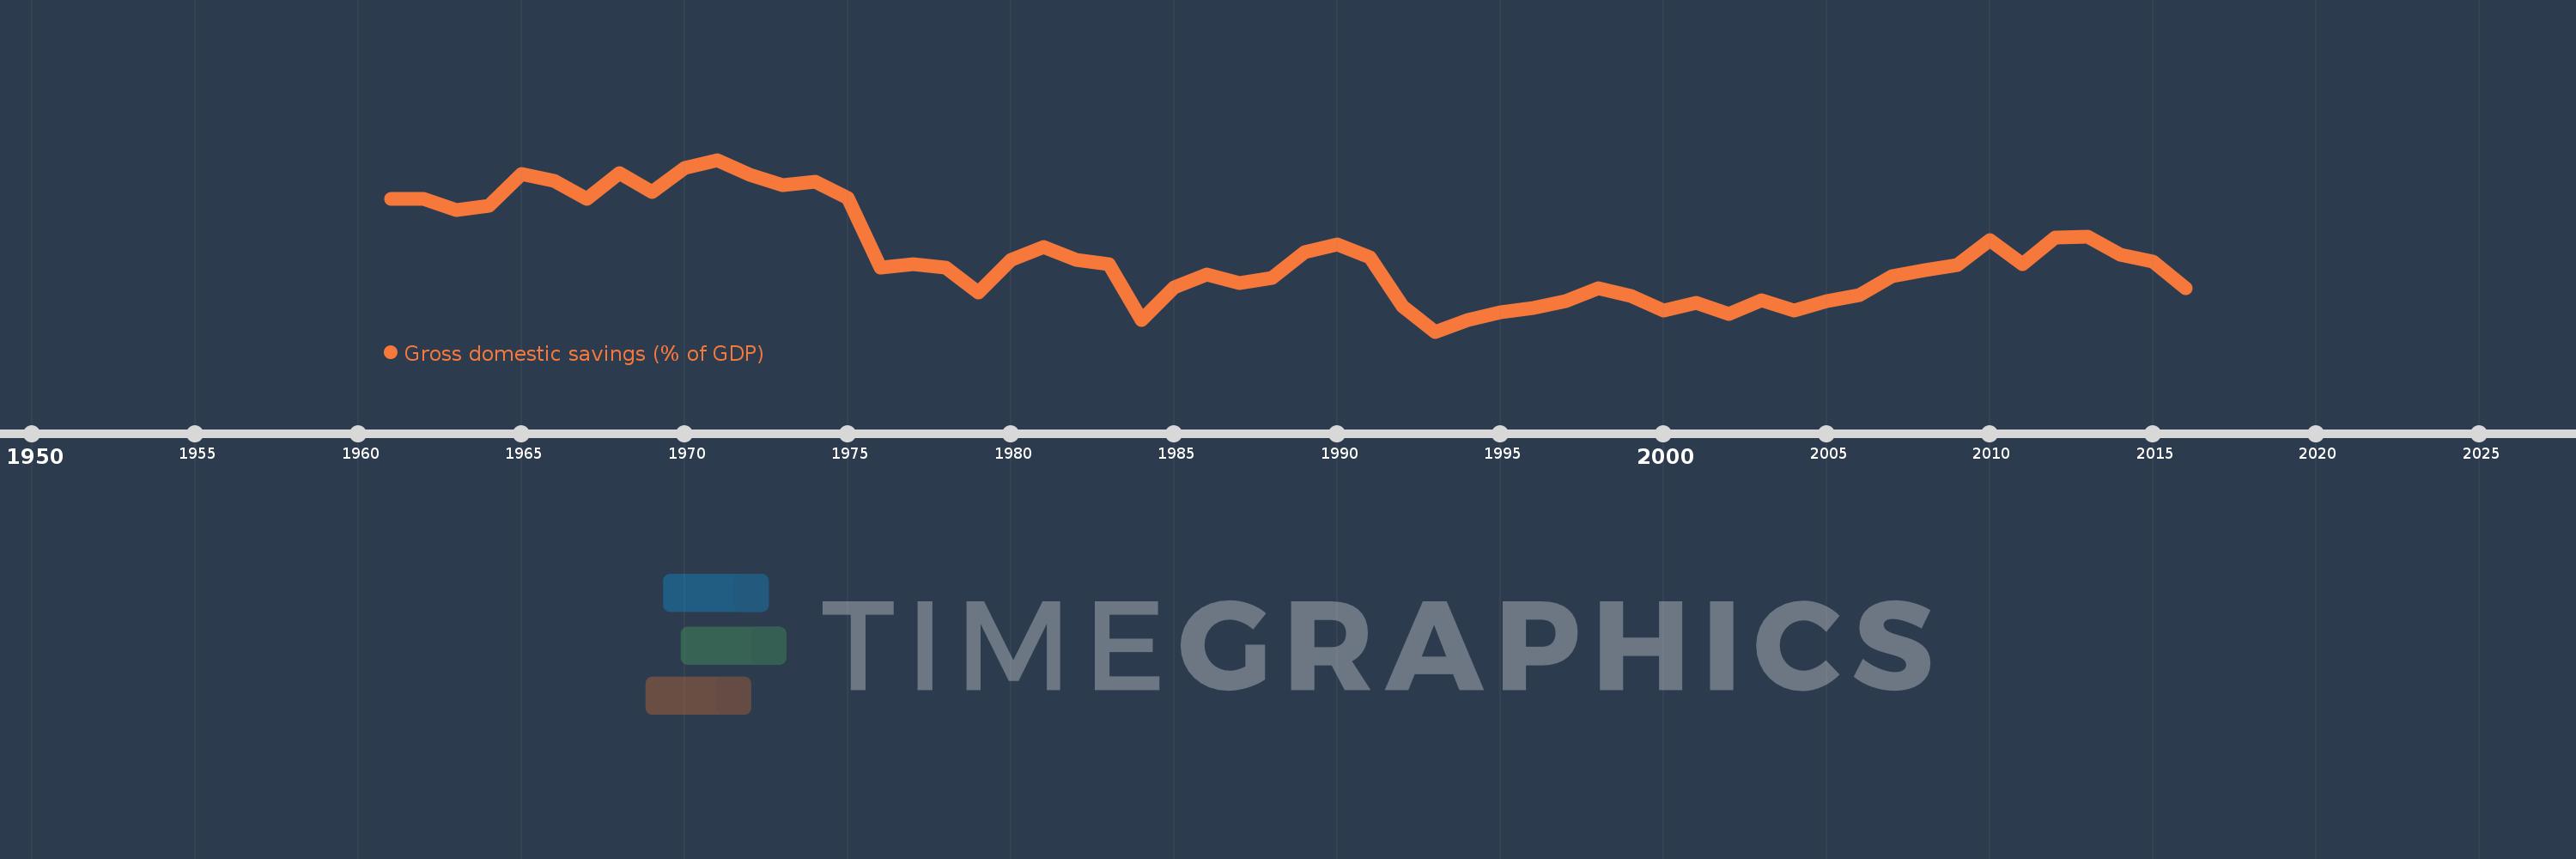
Gross domestic savings (% of GDP)
2016,2015,2014,2013,2012,2011,2010,2009,2008,2007,2006,2005,2004,2003,2002,2001,2000,1999,1998,1997,1996,1995,1994,1993,1992,1991,1990,1989,1988,1987,1986,1985,1984,1983,1982,1981,1980,1979,1978,1977,1976,1975,1974,1973,1972,1971,1970,1969,1968,1967,1966,1965,1964,1963,1962,1961
Queste statistiche in altri paesi:
AfghanistanAlbaniaAlgeriaAngolaAntigua and BarbudaArab WorldArgentinaArmeniaArubaAustraliaAustriaAzerbaijanBahamas, TheBahrainBangladeshBarbadosBelarusBelgiumBelizeBeninBermudaBhutanBoliviaBosnia and HerzegovinaBotswanaBrazilBrunei DarussalamBulgariaBurkina FasoBurundiCabo VerdeCambodiaCameroonCanadaCaribbean small statesCentral African RepublicCentral Europe and the BalticsChadChileChinaColombiaComorosCongo, Dem. Rep.Congo, Rep.Costa RicaCote d'IvoireCroatiaCubaCyprusCzech RepublicDenmarkDjiboutiDominicaDominican RepublicEarly-demographic dividendEast Asia & PacificEast Asia & Pacific (excluding high income)East Asia & Pacific (IDA & IBRD countries)EcuadorEgypt, Arab Rep.El SalvadorEquatorial GuineaEritreaEstoniaEthiopiaEuro areaEurope & Central AsiaEurope & Central Asia (excluding high income)Europe & Central Asia (IDA & IBRD countries)European UnionFaroe IslandsFijiFinlandFragile and conflict affected situationsFranceGabonGambia, TheGeorgiaGermanyGhanaGreeceGrenadaGuatemalaGuineaGuinea-BissauGuyanaHaitiHeavily indebted poor countries (HIPC)High incomeHondurasHong Kong SAR, ChinaHungaryIBRD onlyIcelandIDA & IBRD totalIDA blendIDA onlyIDA totalIndiaIndonesiaIran, Islamic Rep.IraqIrelandIsraelItalyJamaicaJapanJordanKazakhstanKenyaKiribatiKorea, Rep.KosovoKuwaitKyrgyz RepublicLao PDRLate-demographic dividendLatin America & Caribbean Latin America & Caribbean (excluding high income)Latin America & the Caribbean (IDA & IBRD countries)LatviaLeast developed countries: UN classificationLebanonLesothoLiberiaLibyaLithuaniaLow & middle incomeLow incomeLower middle incomeLuxembourgMacao SAR, ChinaMacedonia, FYRMadagascarMalawiMalaysiaMaldivesMaliMaltaMauritaniaMauritiusMexicoMicronesia, Fed. Sts.Middle East & North AfricaMiddle East & North Africa (excluding high income)Middle East & North Africa (IDA & IBRD countries)Middle incomeMoldovaMongoliaMontenegroMoroccoMozambiqueNamibiaNepalNetherlandsNew CaledoniaNew ZealandNicaraguaNigerNigeriaNorth AmericaNorwayOECD membersOmanOther small statesPacific island small statesPakistanPanamaPapua New GuineaParaguayPeruPhilippinesPolandPortugalPost-demographic dividendPre-demographic dividendPuerto RicoQatarRomaniaRussian FederationRwandaSaudi ArabiaSenegalSerbiaSeychellesSierra LeoneSingaporeSlovak RepublicSloveniaSmall statesSolomon IslandsSomaliaSouth AfricaSouth AsiaSouth Asia (IDA & IBRD)South SudanSpainSri LankaSt. Kitts and NevisSt. LuciaSt. Vincent and the GrenadinesSub-Saharan Africa Sub-Saharan Africa (excluding high income)Sub-Saharan Africa (IDA & IBRD countries)SudanSurinameSwazilandSwedenSwitzerlandSyrian Arab RepublicTajikistanTanzaniaThailandTimor-LesteTogoTongaTrinidad and TobagoTunisiaTurkeyTurkmenistanUgandaUkraineUnited Arab EmiratesUnited KingdomUnited StatesUpper middle incomeUruguayUzbekistanVanuatuVenezuela, RBVietnamWest Bank and GazaWorldYemen, Rep.ZambiaZimbabwe Linea del tempo:
Questa scala temporale mostra un grafico dal 1961 anno al 2016 anno. Australia. I dati fino ad 1960 anno non disponibili. Il numero di osservazioni attuali secondo i date: 56.
La fonte (nome):
Indicatori dello sviluppo mondiale
La fonte (organizzazione):
World Bank national accounts data, and OECD National Accounts data files.
Categorie:
Economy & Growth
sono stati aggiornati
23 apr 2017 anni
Indicatori delle variazioni dei valori per anni
Minima:
22.577
1 gen 1993 anni
Massimo:
32.809
1 gen 1971 anni
Alla data di osservazione
Valore
Variazione assoluta
La variazione rispetto al valore precedente
1 gen 1961 anni
30.502
+30.502
0.0%
1 gen 1962 anni
30.503
+0.001
0.0%
1 gen 1963 anni
29.807
-0.696
-2.28%
1 gen 1964 anni
30.065
+0.258
0.86%
1 gen 1965 anni
31.942
+1.877
6.24%
1 gen 1966 anni
31.569
-0.373
-1.17%
1 gen 1967 anni
30.499
-1.07
-3.39%
1 gen 1968 anni
31.993
+1.494
4.9%
1 gen 1969 anni
30.876
-1.117
-3.49%
1 gen 1970 anni
32.332
+1.456
4.72%
1 gen 1971 anni
32.809
+0.477
1.48%
1 gen 1972 anni
31.901
-0.908
-2.77%
1 gen 1973 anni
31.295
-0.606
-1.9%
1 gen 1974 anni
31.527
+0.232
0.74%
1 gen 1975 anni
30.533
-0.995
-3.16%
1 gen 1976 anni
26.394
-4.139
-13.56%
1 gen 1977 anni
26.61
+0.216
0.82%
1 gen 1978 anni
26.373
-0.236
-0.89%
1 gen 1979 anni
24.884
-1.49
-5.65%
1 gen 1980 anni
26.829
+1.946
7.82%
1 gen 1981 anni
27.635
+0.806
3.0%
1 gen 1982 anni
26.865
-0.77
-2.79%
1 gen 1983 anni
26.569
-0.296
-1.1%
1 gen 1984 anni
23.286
-3.283
-12.36%
1 gen 1985 anni
25.216
+1.93
8.29%
1 gen 1986 anni
25.994
+0.778
3.09%
1 gen 1987 anni
25.452
-0.542
-2.09%
1 gen 1988 anni
25.787
+0.335
1.31%
1 gen 1989 anni
27.327
+1.54
5.97%
1 gen 1990 anni
27.779
+0.452
1.65%
1 gen 1991 anni
27.006
-0.773
-2.78%
1 gen 1992 anni
24.062
-2.944
-10.9%
1 gen 1993 anni
22.577
-1.485
-6.17%
1 gen 1994 anni
23.25
+0.673
2.98%
1 gen 1995 anni
23.749
+0.499
2.15%
1 gen 1996 anni
24.0
+0.251
1.06%
1 gen 1997 anni
24.371
+0.372
1.55%
1 gen 1998 anni
25.138
+0.767
3.15%
1 gen 1999 anni
24.712
-0.426
-1.69%
1 gen 2000 anni
23.842
-0.871
-3.52%
1 gen 2001 anni
24.275
+0.434
1.82%
1 gen 2002 anni
23.626
-0.649
-2.67%
1 gen 2003 anni
24.45
+0.824
3.49%
1 gen 2004 anni
23.83
-0.62
-2.54%
1 gen 2005 anni
24.388
+0.558
2.34%
1 gen 2006 anni
24.736
+0.349
1.43%
1 gen 2007 anni
25.876
+1.139
4.61%
1 gen 2008 anni
26.258
+0.383
1.48%
1 gen 2009 anni
26.547
+0.288
1.1%
1 gen 2010 anni
28.026
+1.48
5.57%
1 gen 2011 anni
26.596
-1.43
-5.1%
1 gen 2012 anni
28.166
+1.569
5.9%
1 gen 2013 anni
28.229
+0.063
0.22%
1 gen 2014 anni
27.178
-1.051
-3.72%
1 gen 2015 anni
26.731
-0.446
-1.64%
1 gen 2016 anni
25.174
-1.557
-5.83%
Classificazione dei paesi secondo i statistiche attuali per anni


Commenti: