29
/it/
it
AIzaSyAYiBZKx7MnpbEhh9jyipgxe19OcubqV5w
April 1, 2024
277723
Uruguay
URY
true
2
1
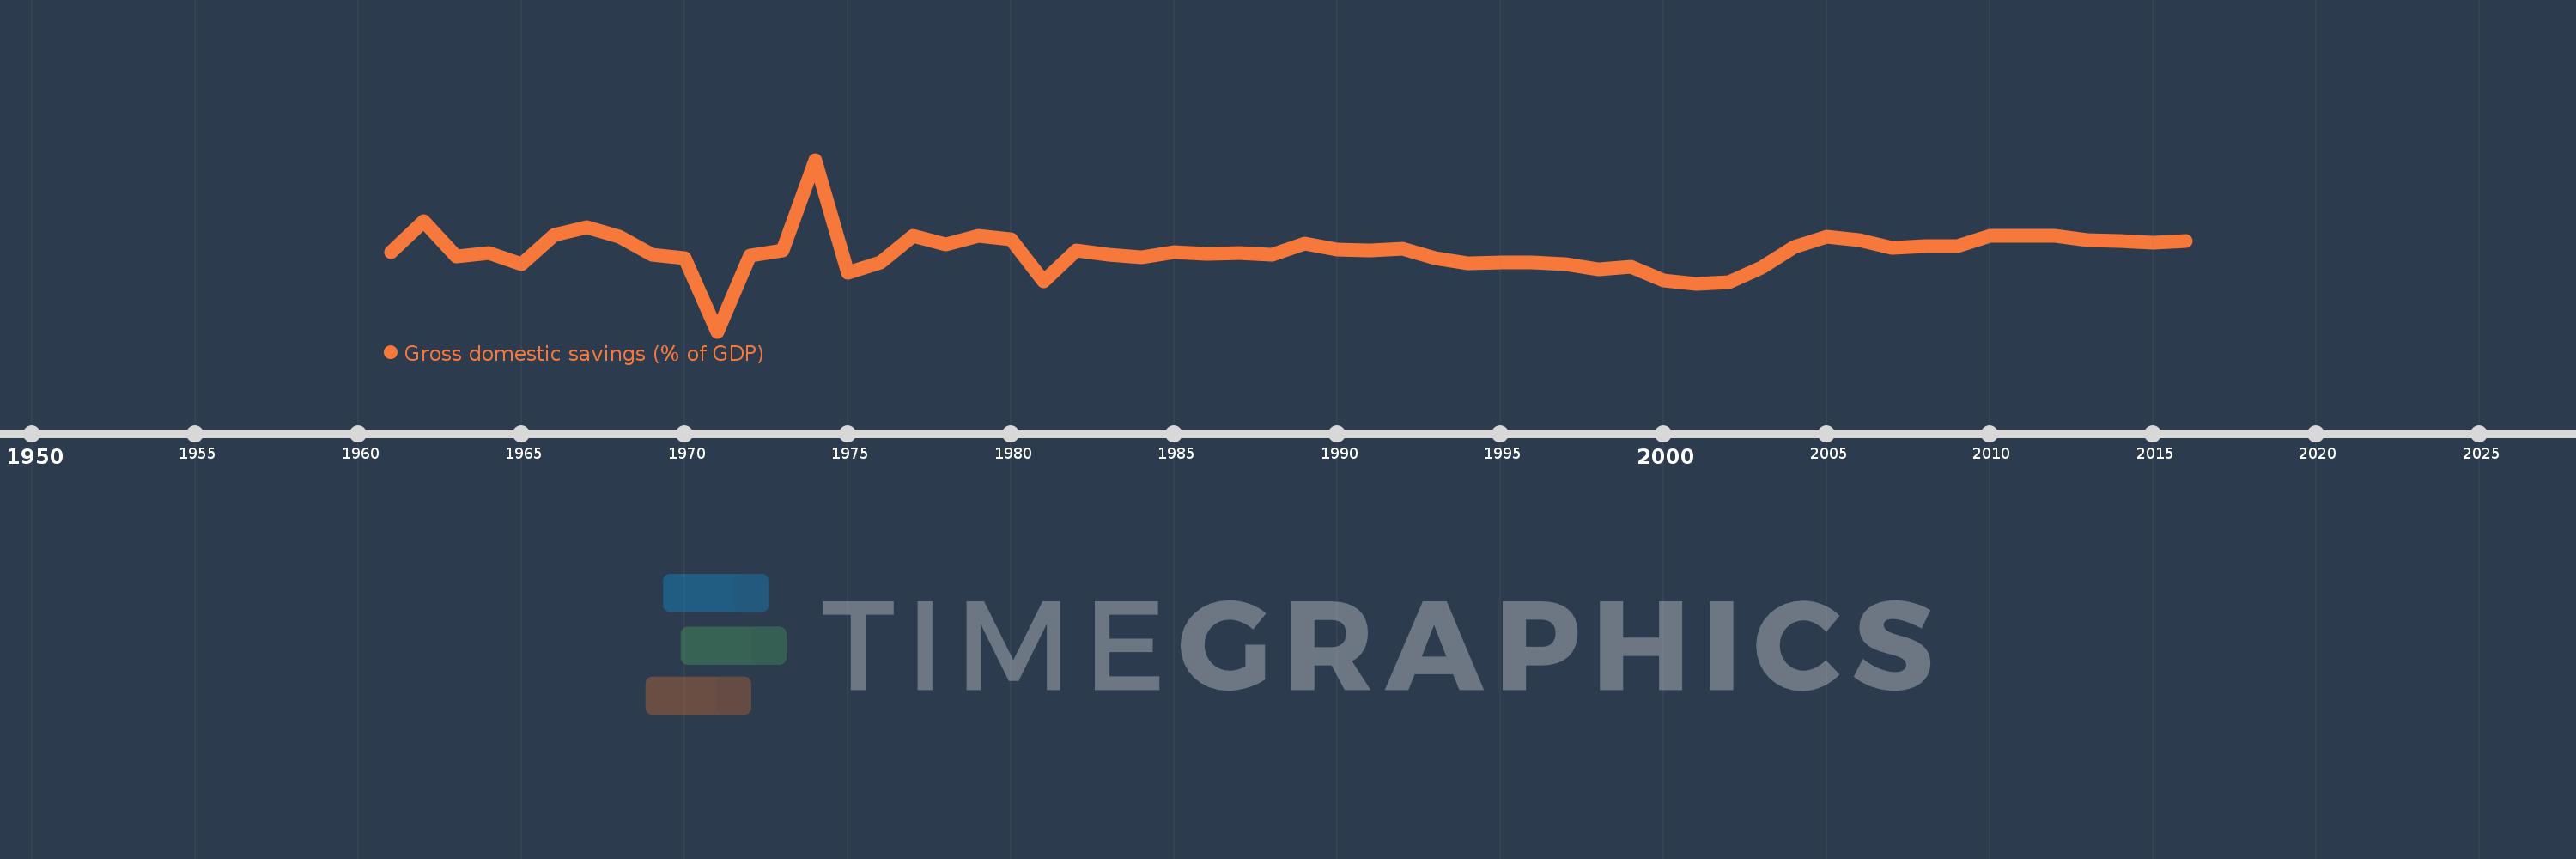
Gross domestic savings (% of GDP)
2016,2015,2014,2013,2012,2011,2010,2009,2008,2007,2006,2005,2004,2003,2002,2001,2000,1999,1998,1997,1996,1995,1994,1993,1992,1991,1990,1989,1988,1987,1986,1985,1984,1983,1982,1981,1980,1979,1978,1977,1976,1975,1974,1973,1972,1971,1970,1969,1968,1967,1966,1965,1964,1963,1962,1961
Queste statistiche in altri paesi:
AfghanistanAlbaniaAlgeriaAngolaAntigua and BarbudaArab WorldArgentinaArmeniaArubaAustraliaAustriaAzerbaijanBahamas, TheBahrainBangladeshBarbadosBelarusBelgiumBelizeBeninBermudaBhutanBoliviaBosnia and HerzegovinaBotswanaBrazilBrunei DarussalamBulgariaBurkina FasoBurundiCabo VerdeCambodiaCameroonCanadaCaribbean small statesCentral African RepublicCentral Europe and the BalticsChadChileChinaColombiaComorosCongo, Dem. Rep.Congo, Rep.Costa RicaCote d'IvoireCroatiaCubaCyprusCzech RepublicDenmarkDjiboutiDominicaDominican RepublicEarly-demographic dividendEast Asia & PacificEast Asia & Pacific (excluding high income)East Asia & Pacific (IDA & IBRD countries)EcuadorEgypt, Arab Rep.El SalvadorEquatorial GuineaEritreaEstoniaEthiopiaEuro areaEurope & Central AsiaEurope & Central Asia (excluding high income)Europe & Central Asia (IDA & IBRD countries)European UnionFaroe IslandsFijiFinlandFragile and conflict affected situationsFranceGabonGambia, TheGeorgiaGermanyGhanaGreeceGrenadaGuatemalaGuineaGuinea-BissauGuyanaHaitiHeavily indebted poor countries (HIPC)High incomeHondurasHong Kong SAR, ChinaHungaryIBRD onlyIcelandIDA & IBRD totalIDA blendIDA onlyIDA totalIndiaIndonesiaIran, Islamic Rep.IraqIrelandIsraelItalyJamaicaJapanJordanKazakhstanKenyaKiribatiKorea, Rep.KosovoKuwaitKyrgyz RepublicLao PDRLate-demographic dividendLatin America & Caribbean Latin America & Caribbean (excluding high income)Latin America & the Caribbean (IDA & IBRD countries)LatviaLeast developed countries: UN classificationLebanonLesothoLiberiaLibyaLithuaniaLow & middle incomeLow incomeLower middle incomeLuxembourgMacao SAR, ChinaMacedonia, FYRMadagascarMalawiMalaysiaMaldivesMaliMaltaMauritaniaMauritiusMexicoMicronesia, Fed. Sts.Middle East & North AfricaMiddle East & North Africa (excluding high income)Middle East & North Africa (IDA & IBRD countries)Middle incomeMoldovaMongoliaMontenegroMoroccoMozambiqueNamibiaNepalNetherlandsNew CaledoniaNew ZealandNicaraguaNigerNigeriaNorth AmericaNorwayOECD membersOmanOther small statesPacific island small statesPakistanPanamaPapua New GuineaParaguayPeruPhilippinesPolandPortugalPost-demographic dividendPre-demographic dividendPuerto RicoQatarRomaniaRussian FederationRwandaSaudi ArabiaSenegalSerbiaSeychellesSierra LeoneSingaporeSlovak RepublicSloveniaSmall statesSolomon IslandsSomaliaSouth AfricaSouth AsiaSouth Asia (IDA & IBRD)South SudanSpainSri LankaSt. Kitts and NevisSt. LuciaSt. Vincent and the GrenadinesSub-Saharan Africa Sub-Saharan Africa (excluding high income)Sub-Saharan Africa (IDA & IBRD countries)SudanSurinameSwazilandSwedenSwitzerlandSyrian Arab RepublicTajikistanTanzaniaThailandTimor-LesteTogoTongaTrinidad and TobagoTunisiaTurkeyTurkmenistanUgandaUkraineUnited Arab EmiratesUnited KingdomUnited StatesUpper middle incomeUruguayUzbekistanVanuatuVenezuela, RBVietnamWest Bank and GazaWorldYemen, Rep.ZambiaZimbabwe Linea del tempo:
Questa scala temporale mostra un grafico dal 1961 anno al 2016 anno. Uruguay. I dati fino ad 1960 anno non disponibili. Il numero di osservazioni attuali secondo i date: 56.
La fonte (nome):
Indicatori dello sviluppo mondiale
La fonte (organizzazione):
World Bank national accounts data, and OECD National Accounts data files.
Categorie:
Economy & Growth
sono stati aggiornati
23 apr 2017 anni
Indicatori delle variazioni dei valori per anni
Minima:
2.075
1 gen 1971 anni
Massimo:
35.021
1 gen 1974 anni
Alla data di osservazione
Valore
Variazione assoluta
La variazione rispetto al valore precedente
1 gen 1961 anni
17.241
+17.241
0.0%
1 gen 1962 anni
23.295
+6.054
35.11%
1 gen 1963 anni
16.495
-6.801
-29.19%
1 gen 1964 anni
17.167
+0.673
4.08%
1 gen 1965 anni
14.925
-2.242
-13.06%
1 gen 1966 anni
20.583
+5.658
37.91%
1 gen 1967 anni
22.154
+1.571
7.63%
1 gen 1968 anni
20.215
-1.939
-8.75%
1 gen 1969 anni
16.834
-3.381
-16.73%
1 gen 1970 anni
16.214
-0.62
-3.68%
1 gen 1971 anni
2.075
-14.139
-87.2%
1 gen 1972 anni
16.59
+14.515
699.34%
1 gen 1973 anni
17.699
+1.109
6.69%
1 gen 1974 anni
35.021
+17.321
97.87%
1 gen 1975 anni
13.345
-21.676
-61.89%
1 gen 1976 anni
15.4
+2.055
15.4%
1 gen 1977 anni
20.44
+5.04
32.72%
1 gen 1978 anni
18.723
-1.716
-8.4%
1 gen 1979 anni
20.403
+1.679
8.97%
1 gen 1980 anni
19.708
-0.695
-3.41%
1 gen 1981 anni
11.748
-7.96
-40.39%
1 gen 1982 anni
17.563
+5.815
49.5%
1 gen 1983 anni
16.832
-0.732
-4.17%
1 gen 1984 anni
16.339
-0.493
-2.93%
1 gen 1985 anni
17.332
+0.993
6.08%
1 gen 1986 anni
17.035
-0.297
-1.71%
1 gen 1987 anni
17.128
+0.093
0.55%
1 gen 1988 anni
16.738
-0.39
-2.28%
1 gen 1989 anni
18.992
+2.254
13.47%
1 gen 1990 anni
17.861
-1.131
-5.96%
1 gen 1991 anni
17.637
-0.224
-1.25%
1 gen 1992 anni
17.958
+0.321
1.82%
1 gen 1993 anni
16.207
-1.751
-9.75%
1 gen 1994 anni
15.208
-0.999
-6.16%
1 gen 1995 anni
15.256
+0.048
0.32%
1 gen 1996 anni
15.304
+0.047
0.31%
1 gen 1997 anni
15.052
-0.252
-1.65%
1 gen 1998 anni
14.055
-0.997
-6.62%
1 gen 1999 anni
14.537
+0.483
3.44%
1 gen 2000 anni
11.884
-2.653
-18.25%
1 gen 2001 anni
11.139
-0.745
-6.27%
1 gen 2002 anni
11.628
+0.488
4.38%
1 gen 2003 anni
14.287
+2.659
22.87%
1 gen 2004 anni
18.312
+4.025
28.17%
1 gen 2005 anni
20.216
+1.904
10.4%
1 gen 2006 anni
19.629
-0.587
-2.9%
1 gen 2007 anni
18.084
-1.545
-7.87%
1 gen 2008 anni
18.497
+0.413
2.28%
1 gen 2009 anni
18.406
-0.091
-0.49%
1 gen 2010 anni
20.429
+2.023
10.99%
1 gen 2011 anni
20.395
-0.034
-0.17%
1 gen 2012 anni
20.48
+0.085
0.42%
1 gen 2013 anni
19.693
-0.786
-3.84%
1 gen 2014 anni
19.473
-0.221
-1.12%
1 gen 2015 anni
19.201
-0.272
-1.4%
1 gen 2016 anni
19.526
+0.325
1.69%
Classificazione dei paesi secondo i statistiche attuali per anni


Commenti: