30
/it/
AIzaSyAYiBZKx7MnpbEhh9jyipgxe19OcubqV5w
April 1, 2024
72932
Australia
AUS
true
2
1
Fertilizer consumption (% of fertilizer production)
2015,2014,2013,2012,2011,2010,2009,2008,2007,2006,2005,2004,2003
Download
Biblioteca di statistiche globali →Australia →

Fertilizer consumption (% of fertilizer production)

Queste statistiche in altri paesi:

AfghanistanAlgeriaArab WorldArgentinaArmeniaAustraliaBahrainBangladeshBelarusBelgiumBosnia and HerzegovinaBrazilBulgariaCanadaCaribbean small statesCentral Europe and the BalticsChileChinaColombiaCroatiaCubaCzech RepublicDenmarkEarly-demographic dividendEast Asia & PacificEast Asia & Pacific (excluding high income)East Asia & Pacific (IDA & IBRD countries)Egypt, Arab Rep.EstoniaEuro areaEurope & Central AsiaEurope & Central Asia (excluding high income)Europe & Central Asia (IDA & IBRD countries)European UnionFinlandFragile and conflict affected situationsFranceGeorgiaGermanyGreeceHeavily indebted poor countries (HIPC)High incomeHungaryIBRD onlyIDA & IBRD totalIDA blendIDA onlyIDA totalIndiaIndonesiaIran, Islamic Rep.IraqIrelandIsraelItalyJapanJordanKazakhstanKorea, Rep.KuwaitLate-demographic dividendLatin America & Caribbean Latin America & Caribbean (excluding high income)Latin America & the Caribbean (IDA & IBRD countries)Least developed countries: UN classificationLebanonLibyaLithuaniaLow & middle incomeLow incomeLower middle incomeMalawiMalaysiaMaliMauritiusMexicoMiddle East & North AfricaMiddle East & North Africa (excluding high income)Middle East & North Africa (IDA & IBRD countries)Middle incomeMoroccoMyanmarNetherlandsNew ZealandNigeriaNorth AmericaNorwayOECD membersOmanOther small statesPakistanPeruPhilippinesPolandPortugalPost-demographic dividendPre-demographic dividendQatarRomaniaRussian FederationSaudi ArabiaSenegalSerbiaSlovak RepublicSloveniaSmall statesSouth AfricaSouth AsiaSouth Asia (IDA & IBRD)SpainSri LankaSub-Saharan Africa Sub-Saharan Africa (excluding high income)Sub-Saharan Africa (IDA & IBRD countries)SwedenSyrian Arab RepublicTajikistanThailandTrinidad and TobagoTunisiaTurkeyUkraineUnited Arab EmiratesUnited KingdomUnited StatesUpper middle incomeUruguayUzbekistanVenezuela, RBVietnamWorldZimbabwe

Linea del tempo:

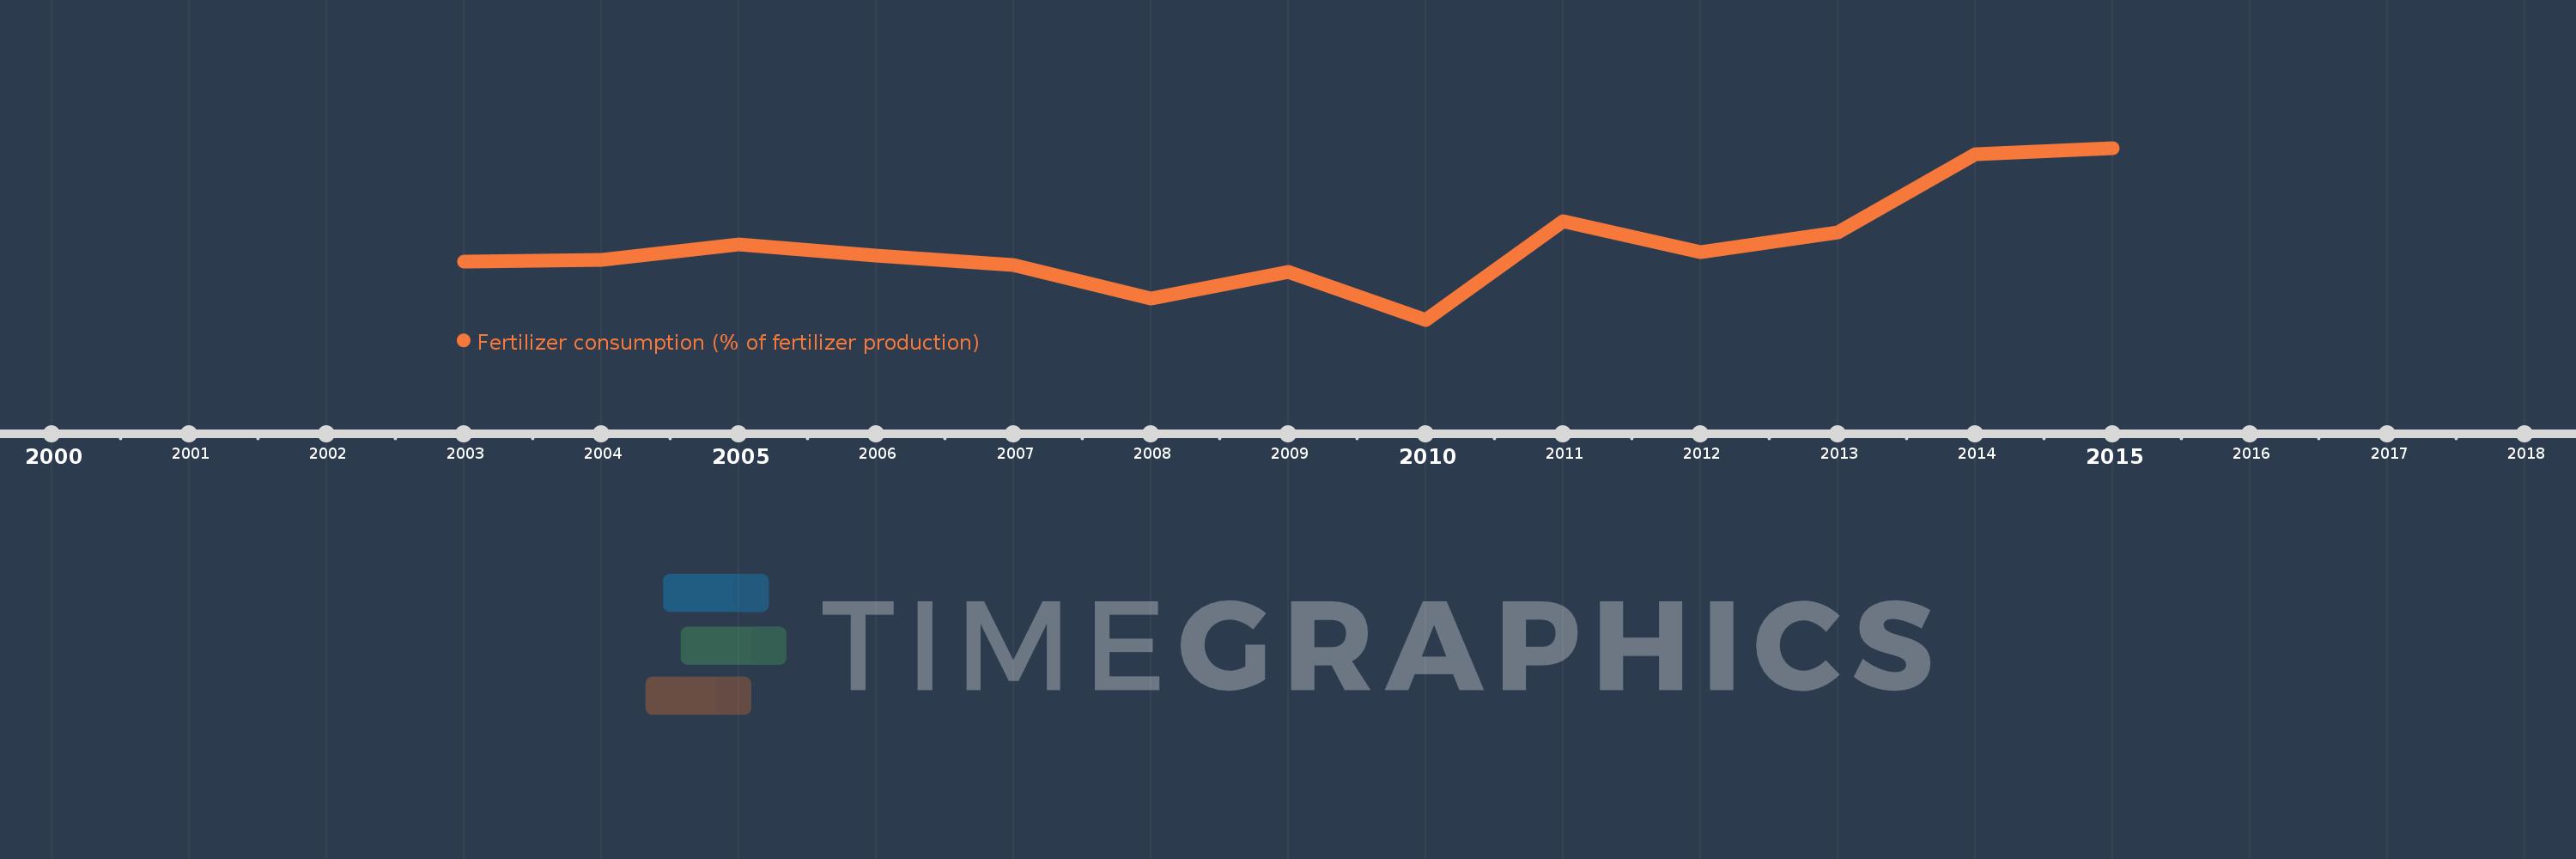
Questa scala temporale mostra un grafico dal 2003 anno al 2015 anno. Australia. I dati fino ad 2002 anno non disponibili. Il numero di osservazioni attuali secondo i date: 13.

La fonte (nome):

Indicatori dello sviluppo mondiale

La fonte (organizzazione):

Food and Agriculture Organization, electronic files and web site.

Categorie:

Agriculture & Rural Development

sono stati aggiornati

23 apr 2017 anni

Indicatori delle variazioni dei valori per anni

In media:
251.236
Minima:
152.631
1 gen 2010 anni
Massimo:
379.256
1 gen 2015 anni
Alla data di osservazione
Valore
Variazione assoluta
La variazione rispetto al valore precedente
1 gen 2003 anni
229.265
+229.265
0.0%
1 gen 2004 anni
231.103
+1.838
0.8%
1 gen 2005 anni
252.346
+21.242
9.19%
1 gen 2006 anni
236.904
-15.441
-6.12%
1 gen 2007 anni
224.655
-12.249
-5.17%
1 gen 2008 anni
181.131
-43.524
-19.37%
1 gen 2009 anni
215.556
+34.425
19.01%
1 gen 2010 anni
152.631
-62.925
-29.19%
1 gen 2011 anni
282.42
+129.789
85.03%
1 gen 2012 anni
242.331
-40.09
-14.19%
1 gen 2013 anni
267.738
+25.408
10.48%
1 gen 2014 anni
370.726
+102.987
38.47%
1 gen 2015 anni
379.256
+8.531
2.3%

Classificazione dei paesi secondo i statistiche attuali per anni