29
/it/
it
AIzaSyAYiBZKx7MnpbEhh9jyipgxe19OcubqV5w
April 1, 2024
32572
Europe & Central Asia (IDA & IBRD countries)
TEC
false
2
1
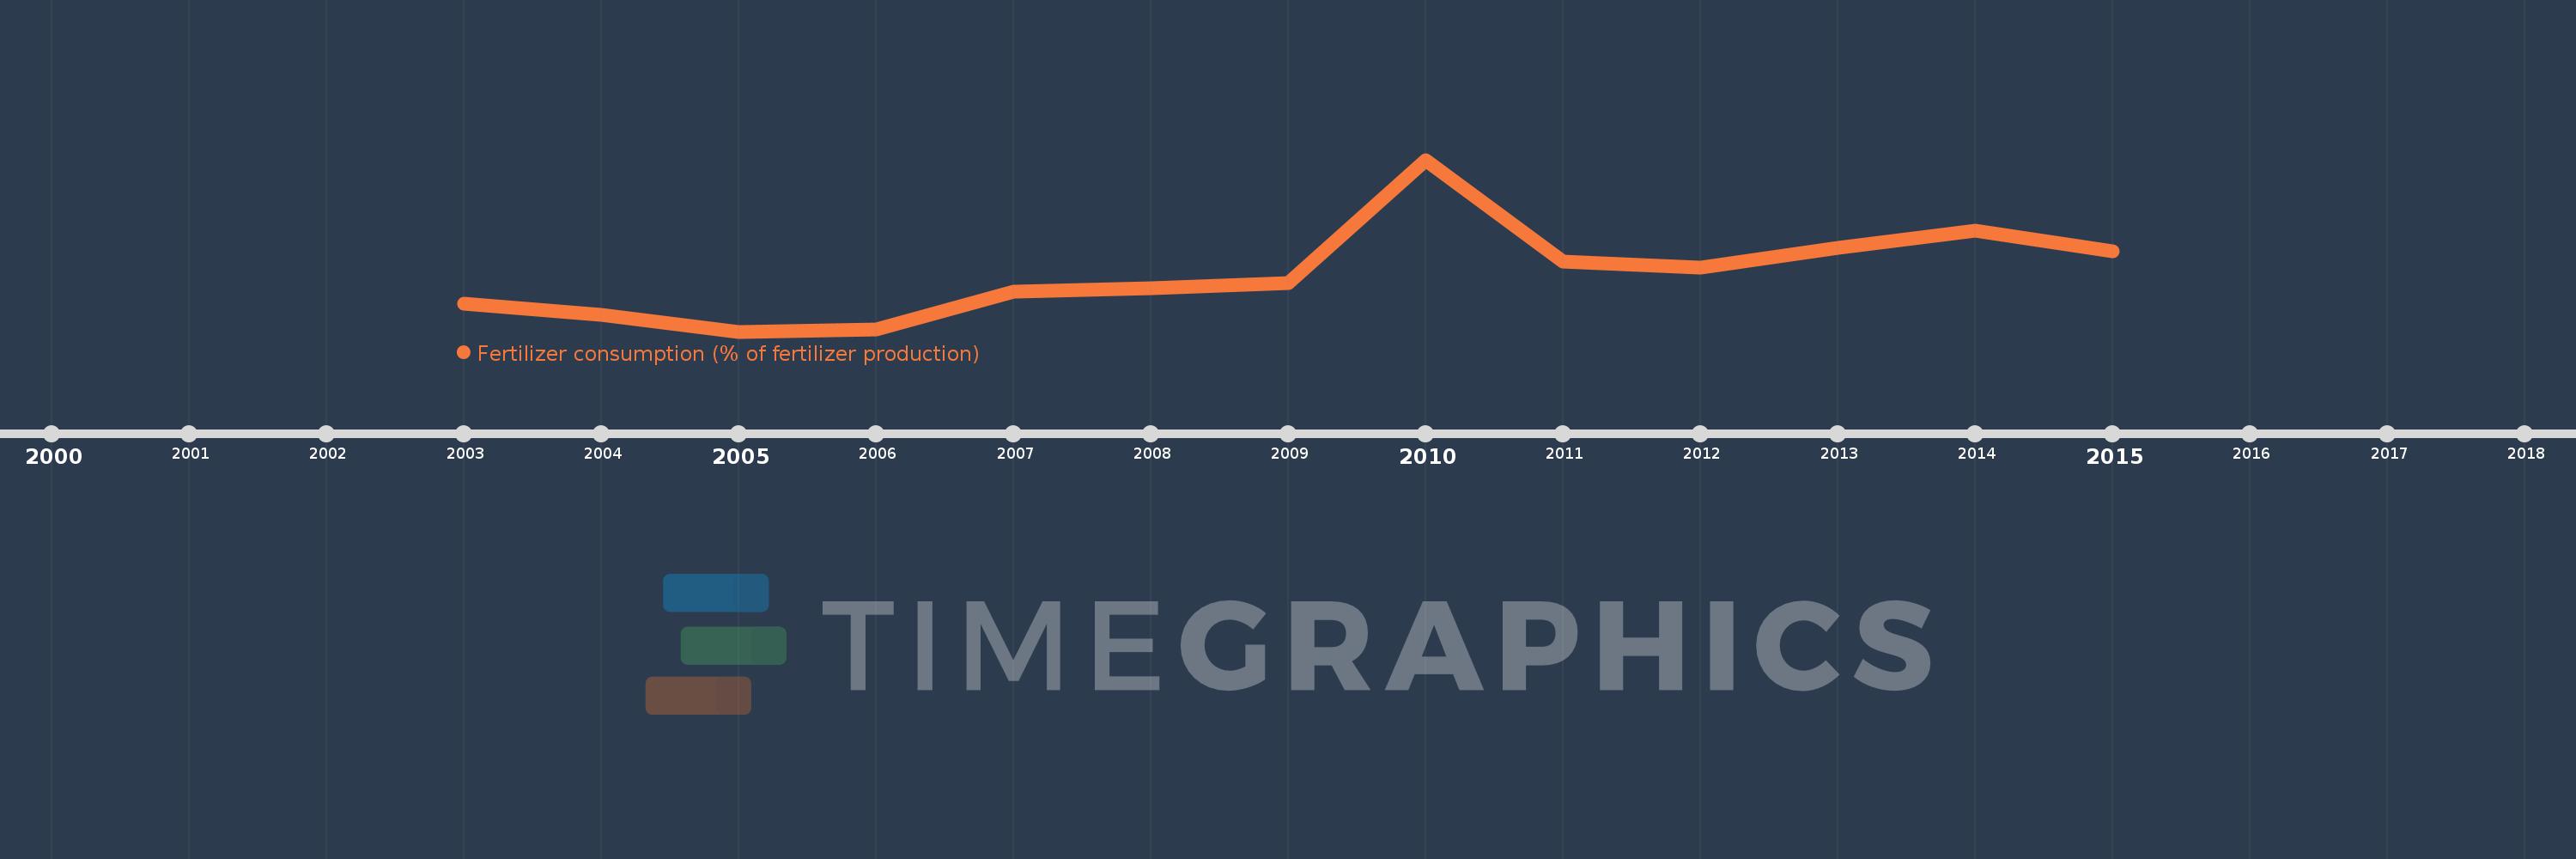
Fertilizer consumption (% of fertilizer production)
2015,2014,2013,2012,2011,2010,2009,2008,2007,2006,2005,2004,2003
Queste statistiche in altri paesi:
Linea del tempo:
Questa scala temporale mostra un grafico dal 2003 anno al 2015 anno. Europe & Central Asia (IDA & IBRD countries). I dati fino ad 2002 anno non disponibili. Il numero di osservazioni attuali secondo i date: 13.
La fonte (nome):
Indicatori dello sviluppo mondiale
La fonte (organizzazione):
Food and Agriculture Organization, electronic files and web site.
Categorie:
Agriculture & Rural Development
sono stati aggiornati
23 apr 2017 anni
Indicatori delle variazioni dei valori per anni
Minima:
25.722
1 gen 2005 anni
Massimo:
49.555
1 gen 2010 anni
Alla data di osservazione
Valore
Variazione assoluta
La variazione rispetto al valore precedente
1 gen 2003 anni
29.58
+29.58
0.0%
1 gen 2004 anni
28.043
-1.536
-5.19%
1 gen 2005 anni
25.722
-2.321
-8.28%
1 gen 2006 anni
26.056
+0.333
1.3%
1 gen 2007 anni
31.218
+5.162
19.81%
1 gen 2008 anni
31.797
+0.579
1.86%
1 gen 2009 anni
32.415
+0.618
1.94%
1 gen 2010 anni
49.555
+17.14
52.88%
1 gen 2011 anni
35.406
-14.149
-28.55%
1 gen 2012 anni
34.633
-0.773
-2.18%
1 gen 2013 anni
37.334
+2.701
7.8%
1 gen 2014 anni
39.738
+2.403
6.44%
1 gen 2015 anni
36.876
-2.861
-7.2%
Classificazione dei paesi secondo i statistiche attuali per anni


Commenti: