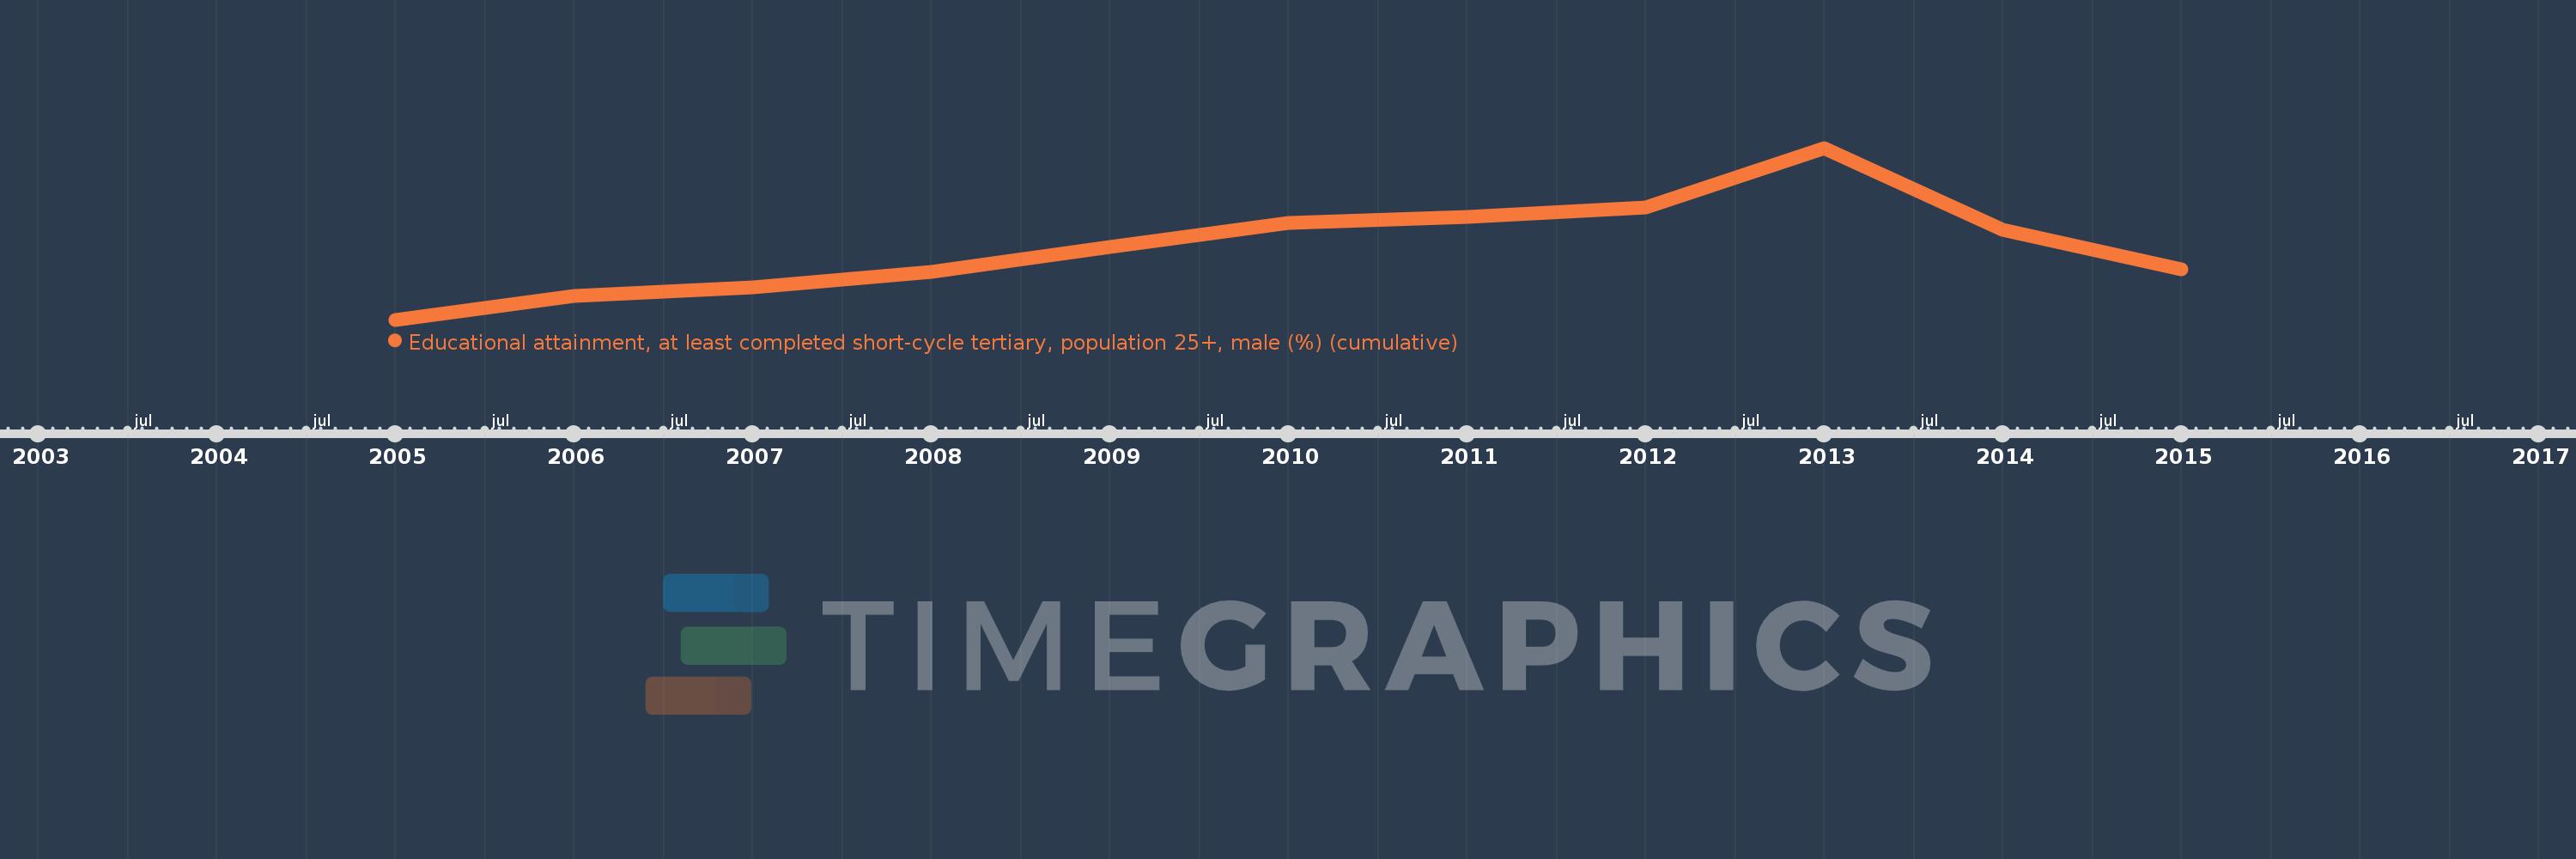
Questa scala temporale mostra un grafico dal 2005 anno al 2015 anno. Australia. I dati fino ad 2004 anno non disponibili. Il numero di osservazioni attuali secondo i date: 11.
La fonte (nome):
Indicatori dello sviluppo mondiale
La fonte (organizzazione):
United Nations Educational, Scientific, and Cultural Organization (UNESCO) Institute for Statistics.
Categorie:
Education, Gender
sono stati aggiornati
23 apr 2017 anni
Indicatori delle variazioni dei valori per anni
In media:
32.646
Minima:
29.046
1 gen 2005 anni
Massimo:
37.554
1 gen 2013 anni
Alla data di osservazione
Valore
Variazione assoluta
La variazione rispetto al valore precedente
1 gen 2005 anni
29.046
+29.046
0.0%
1 gen 2006 anni
30.226
+1.18
4.06%
1 gen 2007 anni
30.631
+0.405
1.34%
1 gen 2008 anni
31.397
+0.766
2.5%
1 gen 2009 anni
32.664
+1.267
4.04%
1 gen 2010 anni
33.826
+1.162
3.56%
1 gen 2011 anni
34.128
+0.302
0.89%
1 gen 2012 anni
34.59
+0.462
1.35%
1 gen 2013 anni
37.554
+2.964
8.57%
1 gen 2014 anni
33.49
-4.064
-10.82%
1 gen 2015 anni
31.551
-1.939
-5.79%
Classificazione dei paesi secondo i statistiche attuali per anni
