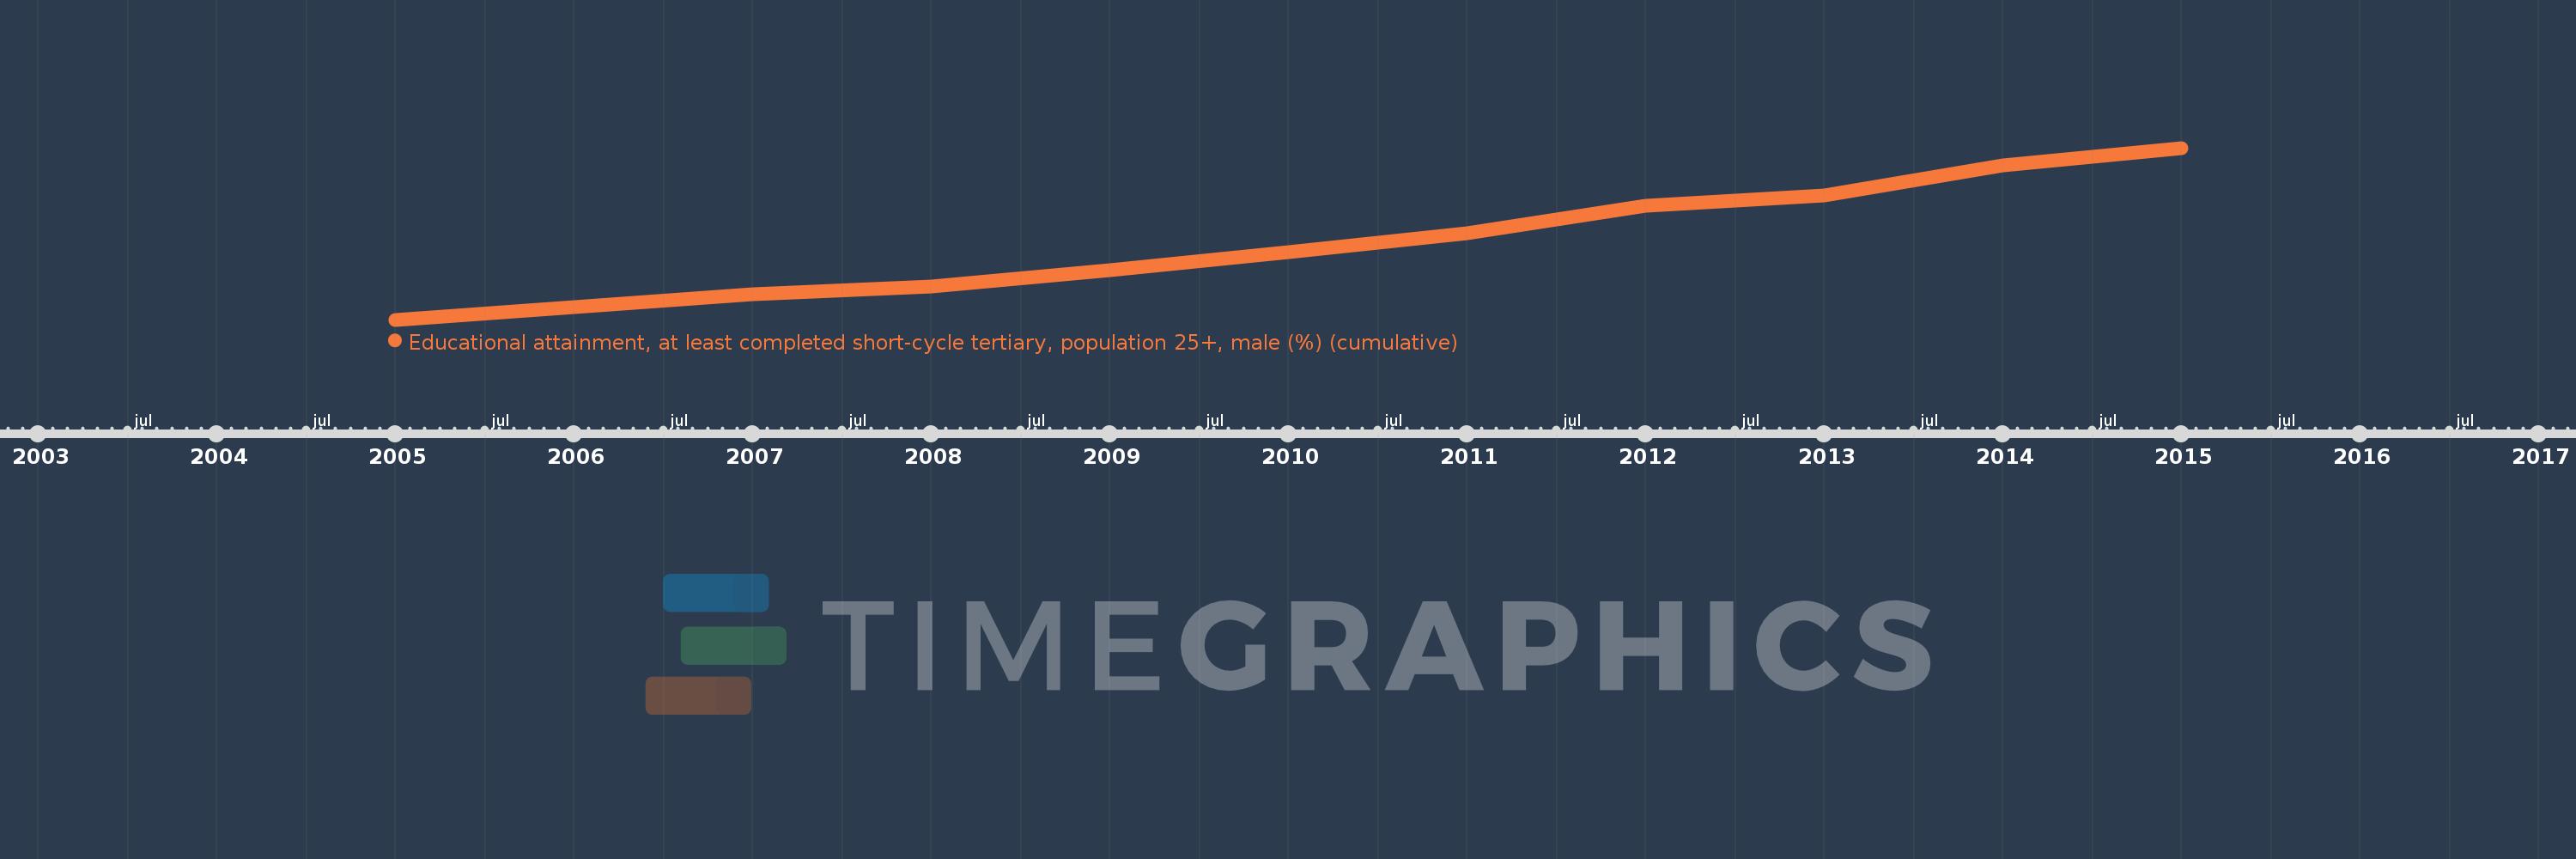
Questa scala temporale mostra un grafico dal 2005 anno al 2015 anno. Turkey. I dati fino ad 2004 anno non disponibili. Il numero di osservazioni attuali secondo i date: 11.
La fonte (nome):
Indicatori dello sviluppo mondiale
La fonte (organizzazione):
United Nations Educational, Scientific, and Cultural Organization (UNESCO) Institute for Statistics.
Categorie:
Education, Gender
sono stati aggiornati
23 apr 2017 anni
Indicatori delle variazioni dei valori per anni
In media:
13.53
Minima:
9.574
1 gen 2005 anni
Massimo:
18.483
1 gen 2015 anni
Alla data di osservazione
Valore
Variazione assoluta
La variazione rispetto al valore precedente
1 gen 2005 anni
9.574
+9.574
0.0%
1 gen 2006 anni
10.24
+0.666
6.95%
1 gen 2007 anni
10.888
+0.648
6.33%
1 gen 2008 anni
11.308
+0.421
3.87%
1 gen 2009 anni
12.146
+0.838
7.41%
1 gen 2010 anni
13.083
+0.937
7.71%
1 gen 2011 anni
14.042
+0.959
7.33%
1 gen 2012 anni
15.469
+1.427
10.16%
1 gen 2013 anni
16.027
+0.558
3.61%
1 gen 2014 anni
17.565
+1.537
9.59%
1 gen 2015 anni
18.483
+0.919
5.23%
Classificazione dei paesi secondo i statistiche attuali per anni
