29
/it/
it
AIzaSyAYiBZKx7MnpbEhh9jyipgxe19OcubqV5w
April 1, 2024
72069
Aruba
ABW
true
2
1
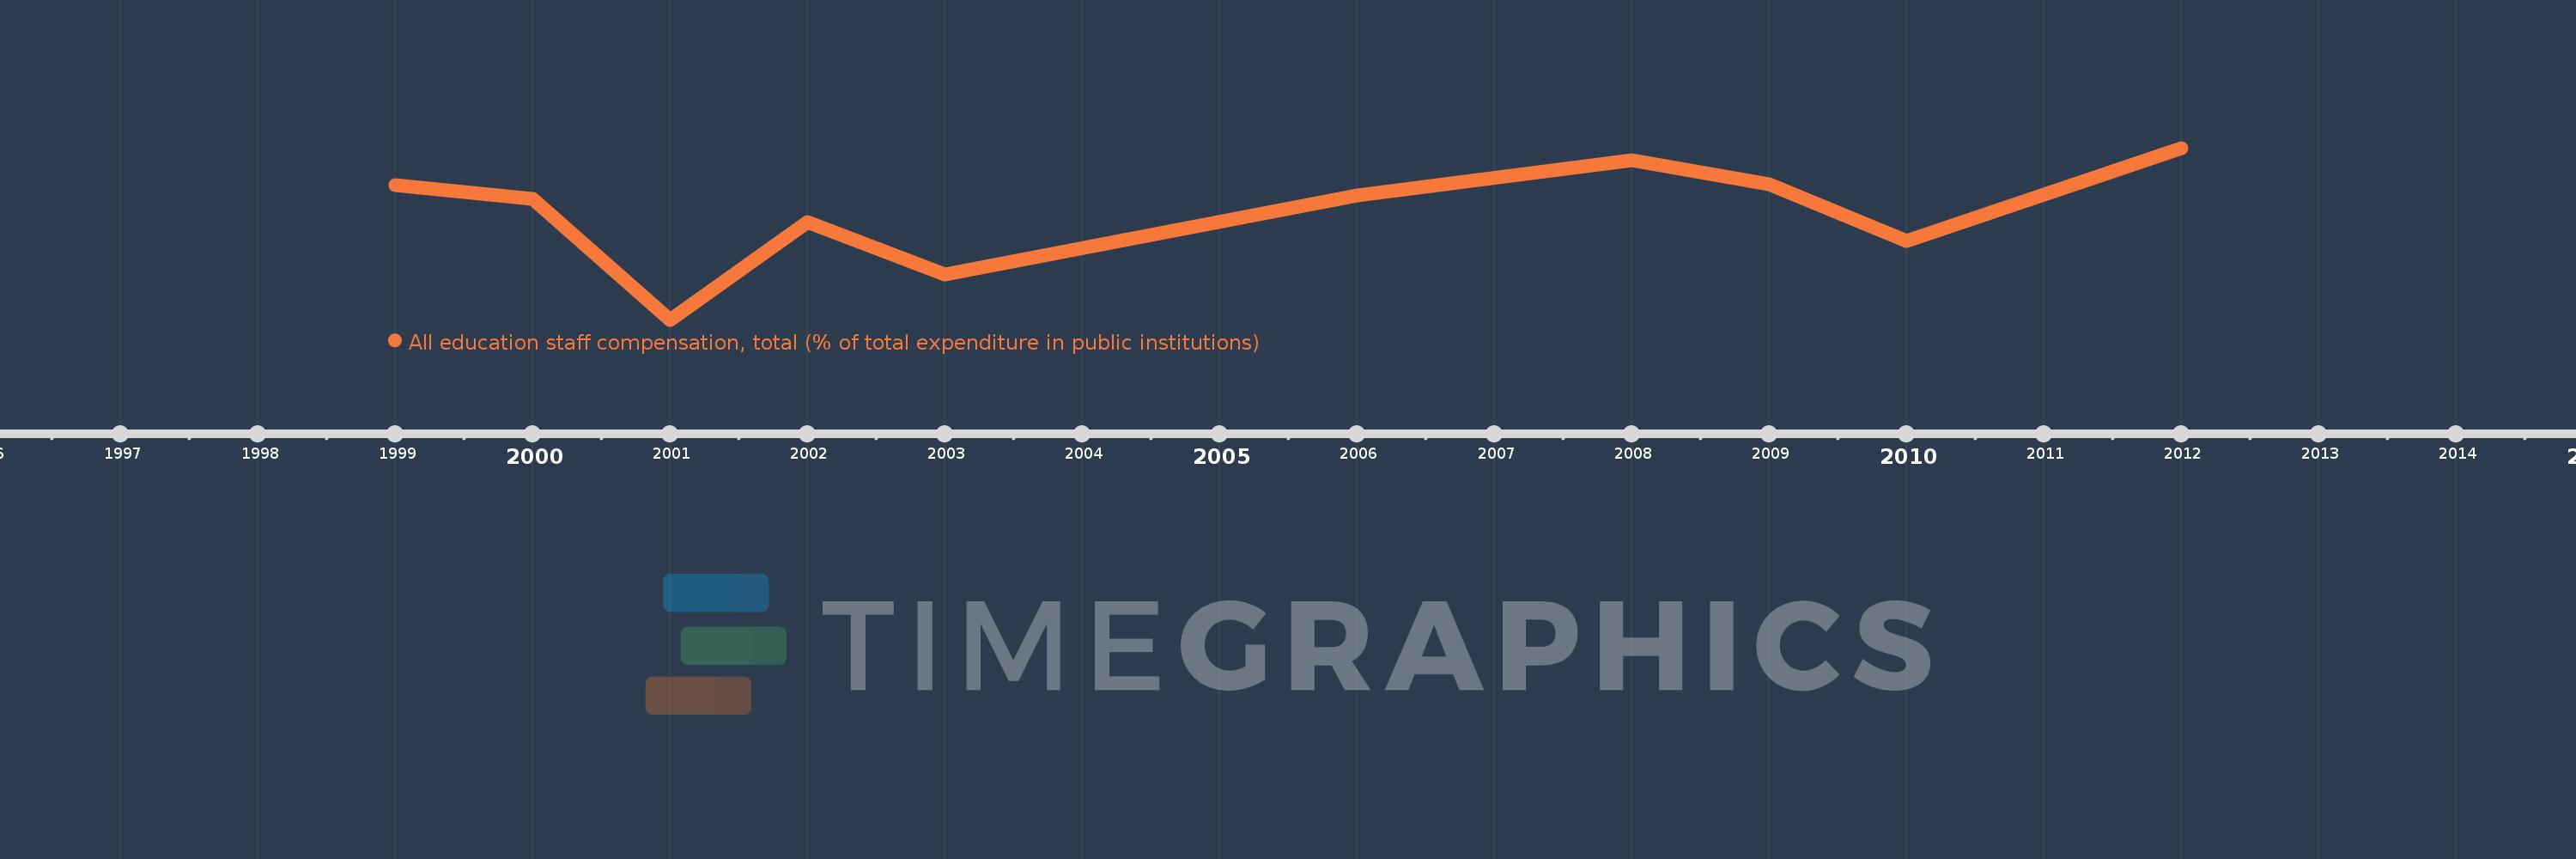
All education staff compensation, total (% of total expenditure in public institutions)
2012,2010,2009,2008,2006,2003,2002,2001,2000,1999
Queste statistiche in altri paesi:
Linea del tempo:
Questa scala temporale mostra un grafico dal 1999 anno al 2012 anno. Aruba. I dati fino ad 1998 anno non disponibili. Il numero di osservazioni attuali secondo i date: 10.
La fonte (nome):
Indicatori dello sviluppo mondiale
La fonte (organizzazione):
United Nations Educational, Scientific, and Cultural Organization (UNESCO) Institute for Statistics.
Categorie:
Education
sono stati aggiornati
23 apr 2017 anni
Indicatori delle variazioni dei valori per anni
Minima:
80.644
1 gen 2001 anni
Massimo:
94.513
1 gen 2012 anni
Alla data di osservazione
Valore
Variazione assoluta
La variazione rispetto al valore precedente
1 gen 1999 anni
91.506
+91.506
0.0%
1 gen 2000 anni
90.371
-1.135
-1.24%
1 gen 2001 anni
80.644
-9.727
-10.76%
1 gen 2002 anni
88.518
+7.874
9.76%
1 gen 2003 anni
84.282
-4.236
-4.79%
1 gen 2006 anni
90.673
+6.391
7.58%
1 gen 2008 anni
93.534
+2.861
3.16%
1 gen 2009 anni
91.58
-1.954
-2.09%
1 gen 2010 anni
87.032
-4.548
-4.97%
1 gen 2012 anni
94.513
+7.481
8.6%
Classificazione dei paesi secondo i statistiche attuali per anni


Commenti: