29
/it/
it
AIzaSyAYiBZKx7MnpbEhh9jyipgxe19OcubqV5w
April 1, 2024
176086
Lebanon
LBN
true
2
1
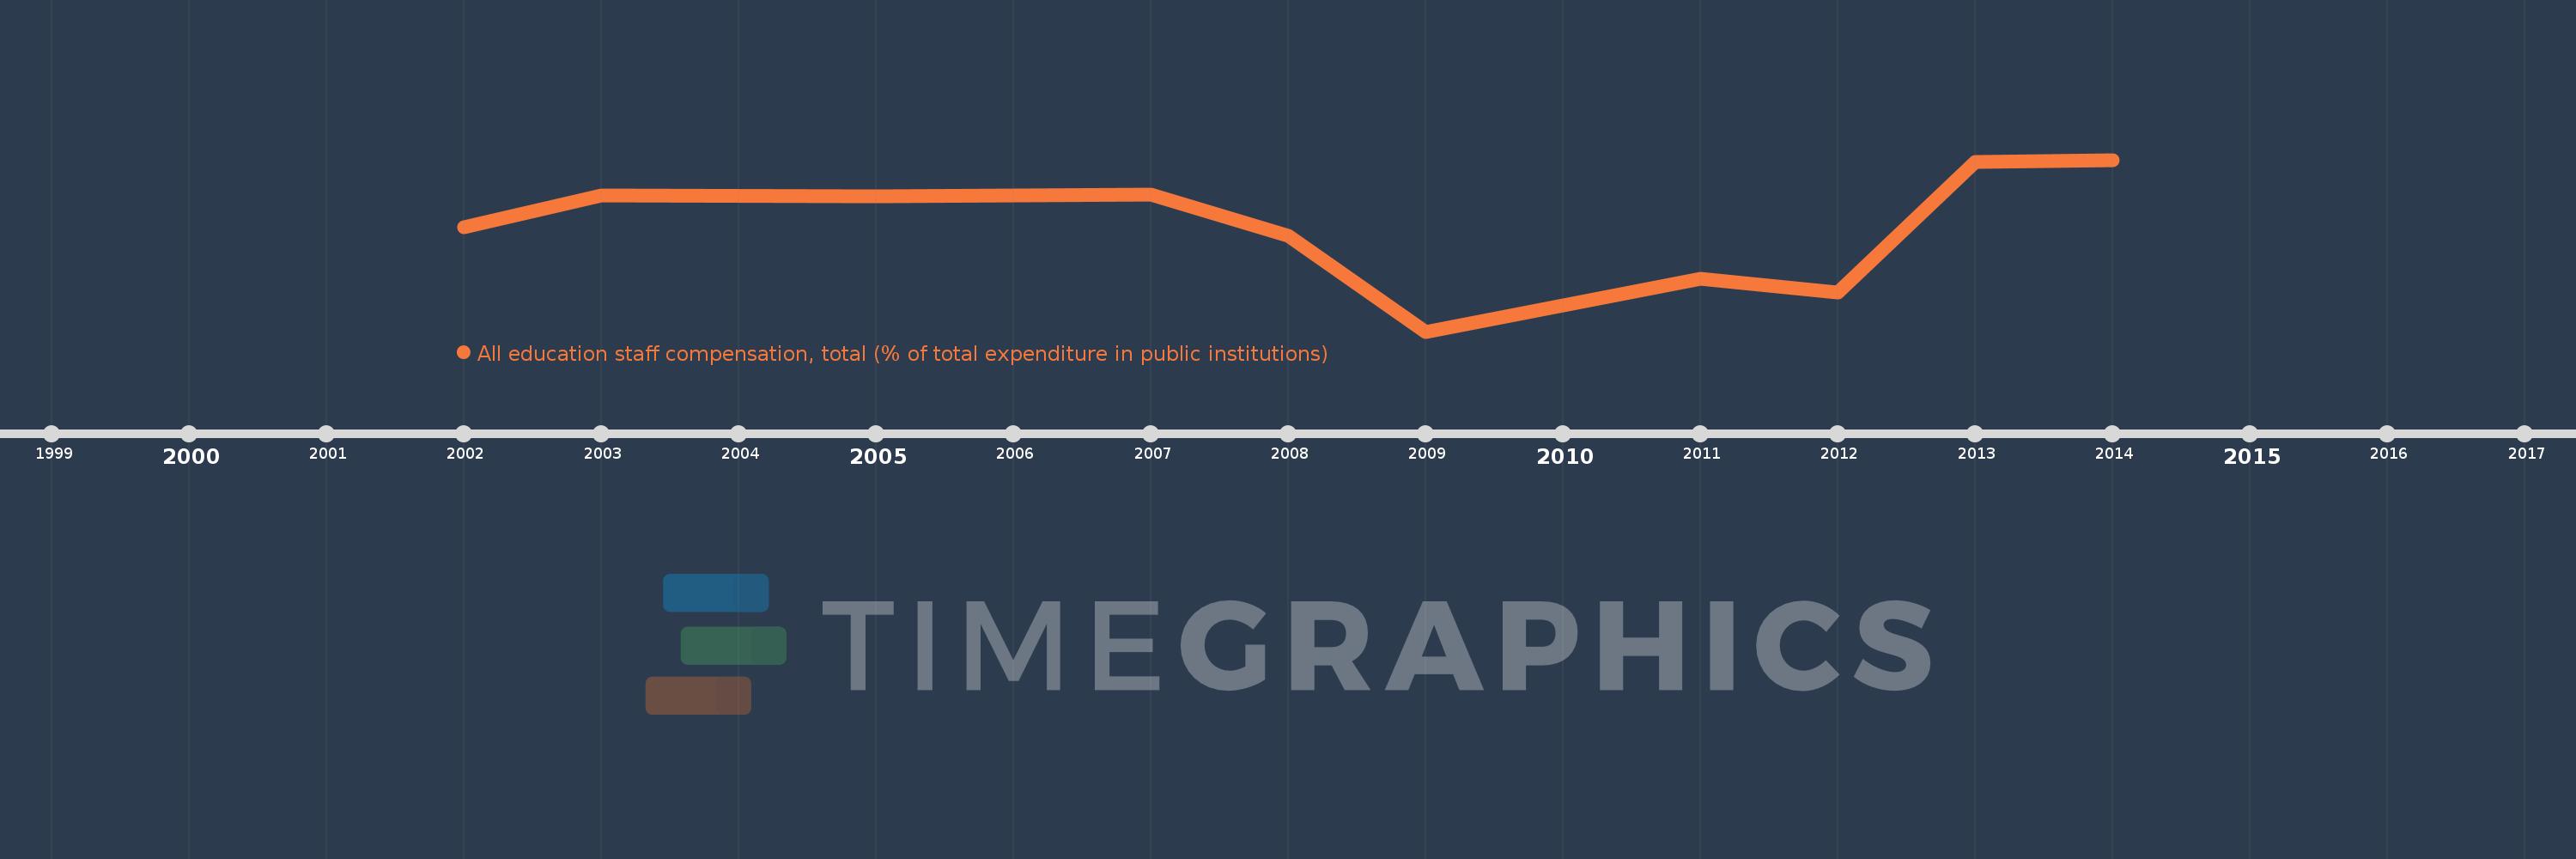
All education staff compensation, total (% of total expenditure in public institutions)
2014,2013,2012,2011,2009,2008,2007,2006,2005,2003,2002
Queste statistiche in altri paesi:
Linea del tempo:
Questa scala temporale mostra un grafico dal 2002 anno al 2014 anno. Lebanon. I dati fino ad 2001 anno non disponibili. Il numero di osservazioni attuali secondo i date: 11.
La fonte (nome):
Indicatori dello sviluppo mondiale
La fonte (organizzazione):
United Nations Educational, Scientific, and Cultural Organization (UNESCO) Institute for Statistics.
Categorie:
Education
sono stati aggiornati
23 apr 2017 anni
Indicatori delle variazioni dei valori per anni
Minima:
83.707
1 gen 2009 anni
Massimo:
97.578
1 gen 2014 anni
Alla data di osservazione
Valore
Variazione assoluta
La variazione rispetto al valore precedente
1 gen 2002 anni
92.157
+92.157
0.0%
1 gen 2003 anni
94.666
+2.509
2.72%
1 gen 2005 anni
94.663
-0.003
0.0%
1 gen 2006 anni
94.707
+0.044
0.05%
1 gen 2007 anni
94.756
+0.048
0.05%
1 gen 2008 anni
91.436
-3.32
-3.5%
1 gen 2009 anni
83.707
-7.729
-8.45%
1 gen 2011 anni
87.985
+4.278
5.11%
1 gen 2012 anni
86.83
-1.155
-1.31%
1 gen 2013 anni
97.415
+10.585
12.19%
1 gen 2014 anni
97.578
+0.163
0.17%
Classificazione dei paesi secondo i statistiche attuali per anni


Commenti: