29
/it/
it
AIzaSyAYiBZKx7MnpbEhh9jyipgxe19OcubqV5w
April 1, 2024
70622
Argentina
ARG
true
2
1
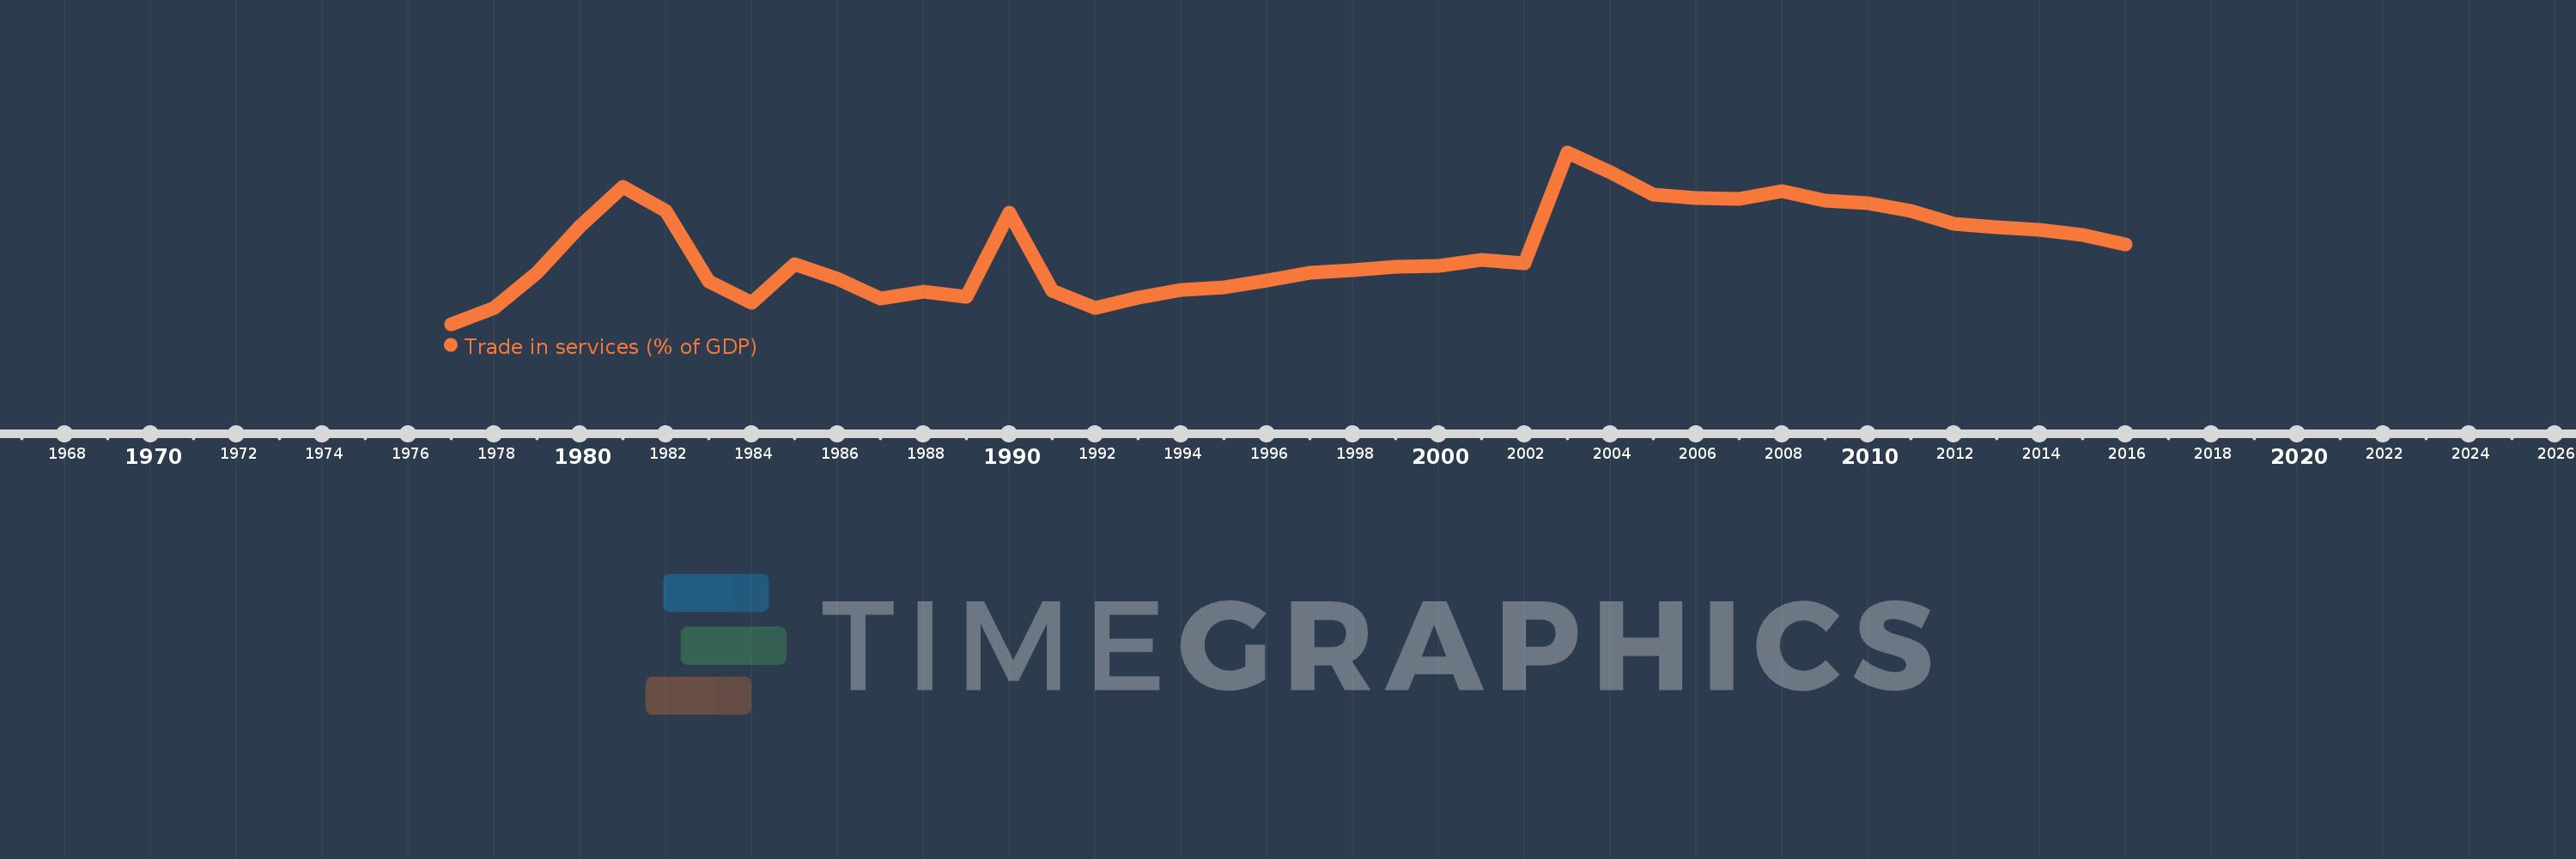
Trade in services (% of GDP)
2016,2015,2014,2013,2012,2011,2010,2009,2008,2007,2006,2005,2004,2003,2002,2001,2000,1999,1998,1997,1996,1995,1994,1993,1992,1991,1990,1989,1988,1987,1986,1985,1984,1983,1982,1981,1980,1979,1978,1977
Queste statistiche in altri paesi:
AfghanistanAlbaniaAlgeriaAngolaAntigua and BarbudaArab WorldArgentinaArmeniaArubaAustraliaAustriaAzerbaijanBahamas, TheBahrainBangladeshBarbadosBelarusBelgiumBelizeBeninBermudaBhutanBoliviaBosnia and HerzegovinaBotswanaBrazilBrunei DarussalamBulgariaBurkina FasoBurundiCabo VerdeCambodiaCameroonCanadaCaribbean small statesCentral African RepublicCentral Europe and the BalticsChadChileChinaColombiaComorosCongo, Dem. Rep.Congo, Rep.Costa RicaCote d'IvoireCroatiaCyprusCzech RepublicDenmarkDjiboutiDominicaDominican RepublicEarly-demographic dividendEast Asia & PacificEast Asia & Pacific (excluding high income)East Asia & Pacific (IDA & IBRD countries)EcuadorEgypt, Arab Rep.El SalvadorEquatorial GuineaEritreaEstoniaEthiopiaEuro areaEurope & Central AsiaEurope & Central Asia (excluding high income)Europe & Central Asia (IDA & IBRD countries)European UnionFaroe IslandsFijiFinlandFragile and conflict affected situationsFranceGabonGambia, TheGeorgiaGermanyGhanaGreeceGrenadaGuatemalaGuineaGuinea-BissauGuyanaHaitiHeavily indebted poor countries (HIPC)High incomeHondurasHong Kong SAR, ChinaHungaryIBRD onlyIcelandIDA & IBRD totalIDA blendIDA onlyIDA totalIndiaIndonesiaIran, Islamic Rep.IraqIrelandIsraelItalyJamaicaJapanJordanKazakhstanKenyaKiribatiKorea, Rep.KosovoKuwaitKyrgyz RepublicLao PDRLate-demographic dividendLatin America & Caribbean Latin America & Caribbean (excluding high income)Latin America & the Caribbean (IDA & IBRD countries)LatviaLeast developed countries: UN classificationLebanonLesothoLiberiaLibyaLithuaniaLow & middle incomeLow incomeLower middle incomeLuxembourgMacao SAR, ChinaMacedonia, FYRMadagascarMalawiMalaysiaMaldivesMaliMaltaMarshall IslandsMauritaniaMauritiusMexicoMicronesia, Fed. Sts.Middle East & North AfricaMiddle East & North Africa (excluding high income)Middle East & North Africa (IDA & IBRD countries)Middle incomeMoldovaMongoliaMontenegroMoroccoMozambiqueMyanmarNamibiaNepalNetherlandsNew ZealandNicaraguaNigerNigeriaNorth AmericaNorwayOECD membersOmanOther small statesPacific island small statesPakistanPalauPanamaPapua New GuineaParaguayPeruPhilippinesPolandPortugalPost-demographic dividendPre-demographic dividendQatarRomaniaRussian FederationRwandaSamoaSao Tome and PrincipeSaudi ArabiaSenegalSerbiaSeychellesSierra LeoneSingaporeSlovak RepublicSloveniaSmall statesSolomon IslandsSouth AfricaSouth AsiaSouth Asia (IDA & IBRD)South SudanSpainSri LankaSt. Kitts and NevisSt. LuciaSt. Vincent and the GrenadinesSub-Saharan Africa Sub-Saharan Africa (excluding high income)Sub-Saharan Africa (IDA & IBRD countries)SudanSurinameSwazilandSwedenSwitzerlandSyrian Arab RepublicTajikistanTanzaniaThailandTimor-LesteTogoTongaTrinidad and TobagoTunisiaTurkeyTuvaluUgandaUkraineUnited KingdomUnited StatesUpper middle incomeUruguayVanuatuVenezuela, RBVietnamWest Bank and GazaWorldYemen, Rep.ZambiaZimbabwe Linea del tempo:
Questa scala temporale mostra un grafico dal 1977 anno al 2016 anno. Argentina. I dati fino ad 1976 anno non disponibili. Il numero di osservazioni attuali secondo i date: 40.
La fonte (nome):
Indicatori dello sviluppo mondiale
La fonte (organizzazione):
International Monetary Fund, Balance of Payments Statistics Yearbook and data files, and World Bank and OECD GDP estimates.
Categorie:
Economy & Growth, Private Sector, Trade
sono stati aggiornati
23 apr 2017 anni
Indicatori delle variazioni dei valori per anni
Minima:
2.845
1 gen 1977 anni
Massimo:
8.477
1 gen 2003 anni
Alla data di osservazione
Valore
Variazione assoluta
La variazione rispetto al valore precedente
1 gen 1977 anni
2.845
+2.845
0.0%
1 gen 1978 anni
3.378
+0.532
18.71%
1 gen 1979 anni
4.53
+1.152
34.1%
1 gen 1980 anni
6.04
+1.51
33.35%
1 gen 1981 anni
7.359
+1.319
21.84%
1 gen 1982 anni
6.546
-0.814
-11.06%
1 gen 1983 anni
4.261
-2.285
-34.91%
1 gen 1984 anni
3.538
-0.722
-16.95%
1 gen 1985 anni
4.805
+1.266
35.79%
1 gen 1986 anni
4.341
-0.464
-9.65%
1 gen 1987 anni
3.693
-0.648
-14.92%
1 gen 1988 anni
3.924
+0.231
6.25%
1 gen 1989 anni
3.738
-0.187
-4.76%
1 gen 1990 anni
6.506
+2.768
74.07%
1 gen 1991 anni
3.938
-2.568
-39.48%
1 gen 1992 anni
3.381
-0.556
-14.13%
1 gen 1993 anni
3.712
+0.331
9.79%
1 gen 1994 anni
3.956
+0.244
6.57%
1 gen 1995 anni
4.055
+0.099
2.5%
1 gen 1996 anni
4.281
+0.225
5.55%
1 gen 1997 anni
4.527
+0.246
5.75%
1 gen 1998 anni
4.624
+0.097
2.15%
1 gen 1999 anni
4.721
+0.097
2.11%
1 gen 2000 anni
4.765
+0.044
0.92%
1 gen 2001 anni
4.954
+0.189
3.97%
1 gen 2002 anni
4.848
-0.106
-2.14%
1 gen 2003 anni
8.477
+3.629
74.87%
1 gen 2004 anni
7.819
-0.658
-7.77%
1 gen 2005 anni
7.094
-0.725
-9.27%
1 gen 2006 anni
6.995
-0.099
-1.4%
1 gen 2007 anni
6.945
-0.05
-0.71%
1 gen 2008 anni
7.215
+0.269
3.88%
1 gen 2009 anni
6.91
-0.304
-4.22%
1 gen 2010 anni
6.804
-0.106
-1.54%
1 gen 2011 anni
6.568
-0.236
-3.47%
1 gen 2012 anni
6.144
-0.424
-6.45%
1 gen 2013 anni
6.012
-0.131
-2.14%
1 gen 2014 anni
5.927
-0.086
-1.42%
1 gen 2015 anni
5.765
-0.162
-2.73%
1 gen 2016 anni
5.45
-0.315
-5.46%
Classificazione dei paesi secondo i statistiche attuali per anni


Commenti: