29
/it/
it
AIzaSyAYiBZKx7MnpbEhh9jyipgxe19OcubqV5w
April 1, 2024
277215
United States
USA
true
2
1
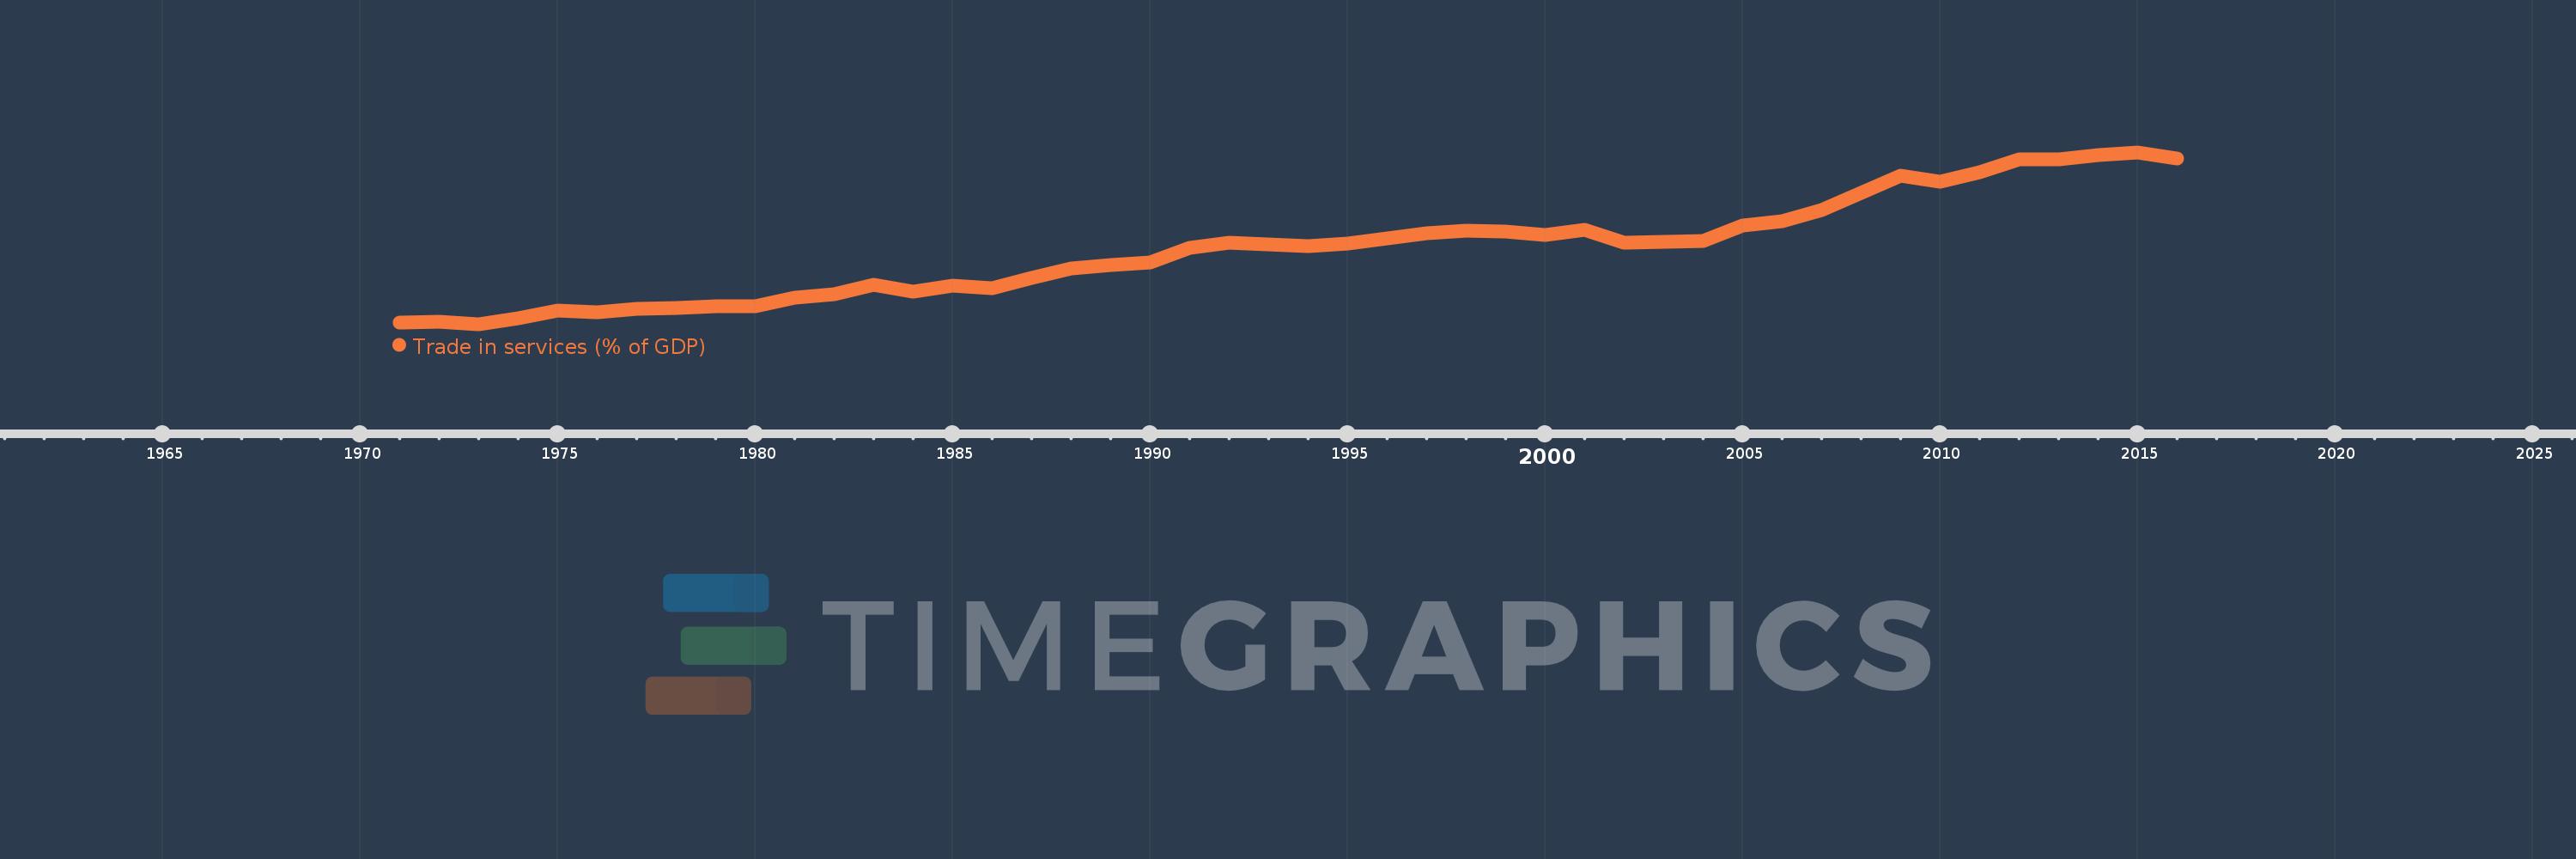
Trade in services (% of GDP)
2016,2015,2014,2013,2012,2011,2010,2009,2008,2007,2006,2005,2004,2003,2002,2001,2000,1999,1998,1997,1996,1995,1994,1993,1992,1991,1990,1989,1988,1987,1986,1985,1984,1983,1982,1981,1980,1979,1978,1977,1976,1975,1974,1973,1972,1971
Queste statistiche in altri paesi:
AfghanistanAlbaniaAlgeriaAngolaAntigua and BarbudaArab WorldArgentinaArmeniaArubaAustraliaAustriaAzerbaijanBahamas, TheBahrainBangladeshBarbadosBelarusBelgiumBelizeBeninBermudaBhutanBoliviaBosnia and HerzegovinaBotswanaBrazilBrunei DarussalamBulgariaBurkina FasoBurundiCabo VerdeCambodiaCameroonCanadaCaribbean small statesCentral African RepublicCentral Europe and the BalticsChadChileChinaColombiaComorosCongo, Dem. Rep.Congo, Rep.Costa RicaCote d'IvoireCroatiaCyprusCzech RepublicDenmarkDjiboutiDominicaDominican RepublicEarly-demographic dividendEast Asia & PacificEast Asia & Pacific (excluding high income)East Asia & Pacific (IDA & IBRD countries)EcuadorEgypt, Arab Rep.El SalvadorEquatorial GuineaEritreaEstoniaEthiopiaEuro areaEurope & Central AsiaEurope & Central Asia (excluding high income)Europe & Central Asia (IDA & IBRD countries)European UnionFaroe IslandsFijiFinlandFragile and conflict affected situationsFranceGabonGambia, TheGeorgiaGermanyGhanaGreeceGrenadaGuatemalaGuineaGuinea-BissauGuyanaHaitiHeavily indebted poor countries (HIPC)High incomeHondurasHong Kong SAR, ChinaHungaryIBRD onlyIcelandIDA & IBRD totalIDA blendIDA onlyIDA totalIndiaIndonesiaIran, Islamic Rep.IraqIrelandIsraelItalyJamaicaJapanJordanKazakhstanKenyaKiribatiKorea, Rep.KosovoKuwaitKyrgyz RepublicLao PDRLate-demographic dividendLatin America & Caribbean Latin America & Caribbean (excluding high income)Latin America & the Caribbean (IDA & IBRD countries)LatviaLeast developed countries: UN classificationLebanonLesothoLiberiaLibyaLithuaniaLow & middle incomeLow incomeLower middle incomeLuxembourgMacao SAR, ChinaMacedonia, FYRMadagascarMalawiMalaysiaMaldivesMaliMaltaMarshall IslandsMauritaniaMauritiusMexicoMicronesia, Fed. Sts.Middle East & North AfricaMiddle East & North Africa (excluding high income)Middle East & North Africa (IDA & IBRD countries)Middle incomeMoldovaMongoliaMontenegroMoroccoMozambiqueMyanmarNamibiaNepalNetherlandsNew ZealandNicaraguaNigerNigeriaNorth AmericaNorwayOECD membersOmanOther small statesPacific island small statesPakistanPalauPanamaPapua New GuineaParaguayPeruPhilippinesPolandPortugalPost-demographic dividendPre-demographic dividendQatarRomaniaRussian FederationRwandaSamoaSao Tome and PrincipeSaudi ArabiaSenegalSerbiaSeychellesSierra LeoneSingaporeSlovak RepublicSloveniaSmall statesSolomon IslandsSouth AfricaSouth AsiaSouth Asia (IDA & IBRD)South SudanSpainSri LankaSt. Kitts and NevisSt. LuciaSt. Vincent and the GrenadinesSub-Saharan Africa Sub-Saharan Africa (excluding high income)Sub-Saharan Africa (IDA & IBRD countries)SudanSurinameSwazilandSwedenSwitzerlandSyrian Arab RepublicTajikistanTanzaniaThailandTimor-LesteTogoTongaTrinidad and TobagoTunisiaTurkeyTuvaluUgandaUkraineUnited KingdomUnited StatesUpper middle incomeUruguayVanuatuVenezuela, RBVietnamWest Bank and GazaWorldYemen, Rep.ZambiaZimbabwe Linea del tempo:
Questa scala temporale mostra un grafico dal 1971 anno al 2016 anno. United States. I dati fino ad 1970 anno non disponibili. Il numero di osservazioni attuali secondo i date: 46.
La fonte (nome):
Indicatori dello sviluppo mondiale
La fonte (organizzazione):
International Monetary Fund, Balance of Payments Statistics Yearbook and data files, and World Bank and OECD GDP estimates.
Categorie:
Economy & Growth, Private Sector, Trade
sono stati aggiornati
23 apr 2017 anni
Indicatori delle variazioni dei valori per anni
Minima:
2.37
1 gen 1973 anni
Massimo:
7.04
1 gen 2015 anni
Alla data di osservazione
Valore
Variazione assoluta
La variazione rispetto al valore precedente
1 gen 1971 anni
2.426
+2.426
0.0%
1 gen 1972 anni
2.429
+0.004
0.14%
1 gen 1973 anni
2.37
-0.059
-2.43%
1 gen 1974 anni
2.529
+0.159
6.69%
1 gen 1975 anni
2.739
+0.21
8.32%
1 gen 1976 anni
2.7
-0.04
-1.44%
1 gen 1977 anni
2.796
+0.096
3.54%
1 gen 1978 anni
2.815
+0.019
0.69%
1 gen 1979 anni
2.849
+0.034
1.21%
1 gen 1980 anni
2.852
+0.003
0.09%
1 gen 1981 anni
3.092
+0.241
8.44%
1 gen 1982 anni
3.181
+0.088
2.85%
1 gen 1983 anni
3.439
+0.258
8.12%
1 gen 1984 anni
3.257
-0.182
-5.3%
1 gen 1985 anni
3.416
+0.159
4.89%
1 gen 1986 anni
3.339
-0.077
-2.26%
1 gen 1987 anni
3.635
+0.296
8.88%
1 gen 1988 anni
3.89
+0.255
7.01%
1 gen 1989 anni
3.989
+0.099
2.55%
1 gen 1990 anni
4.059
+0.07
1.76%
1 gen 1991 anni
4.441
+0.382
9.4%
1 gen 1992 anni
4.58
+0.139
3.13%
1 gen 1993 anni
4.539
-0.041
-0.9%
1 gen 1994 anni
4.502
-0.037
-0.81%
1 gen 1995 anni
4.563
+0.061
1.35%
1 gen 1996 anni
4.705
+0.143
3.12%
1 gen 1997 anni
4.84
+0.135
2.87%
1 gen 1998 anni
4.903
+0.062
1.29%
1 gen 1999 anni
4.879
-0.024
-0.49%
1 gen 2000 anni
4.806
-0.073
-1.5%
1 gen 2001 anni
4.925
+0.119
2.48%
1 gen 2002 anni
4.592
-0.332
-6.75%
1 gen 2003 anni
4.601
+0.008
0.18%
1 gen 2004 anni
4.623
+0.023
0.49%
1 gen 2005 anni
5.059
+0.436
9.43%
1 gen 2006 anni
5.174
+0.114
2.26%
1 gen 2007 anni
5.47
+0.296
5.72%
1 gen 2008 anni
5.947
+0.477
8.72%
1 gen 2009 anni
6.399
+0.452
7.61%
1 gen 2010 anni
6.239
-0.161
-2.51%
1 gen 2011 anni
6.5
+0.261
4.19%
1 gen 2012 anni
6.854
+0.354
5.45%
1 gen 2013 anni
6.861
+0.007
0.11%
1 gen 2014 anni
6.965
+0.104
1.51%
1 gen 2015 anni
7.04
+0.075
1.08%
1 gen 2016 anni
6.872
-0.168
-2.39%
Classificazione dei paesi secondo i statistiche attuali per anni


Commenti: