29
/it/
it
AIzaSyAYiBZKx7MnpbEhh9jyipgxe19OcubqV5w
April 1, 2024
69177
Antigua and Barbuda
ATG
true
2
1
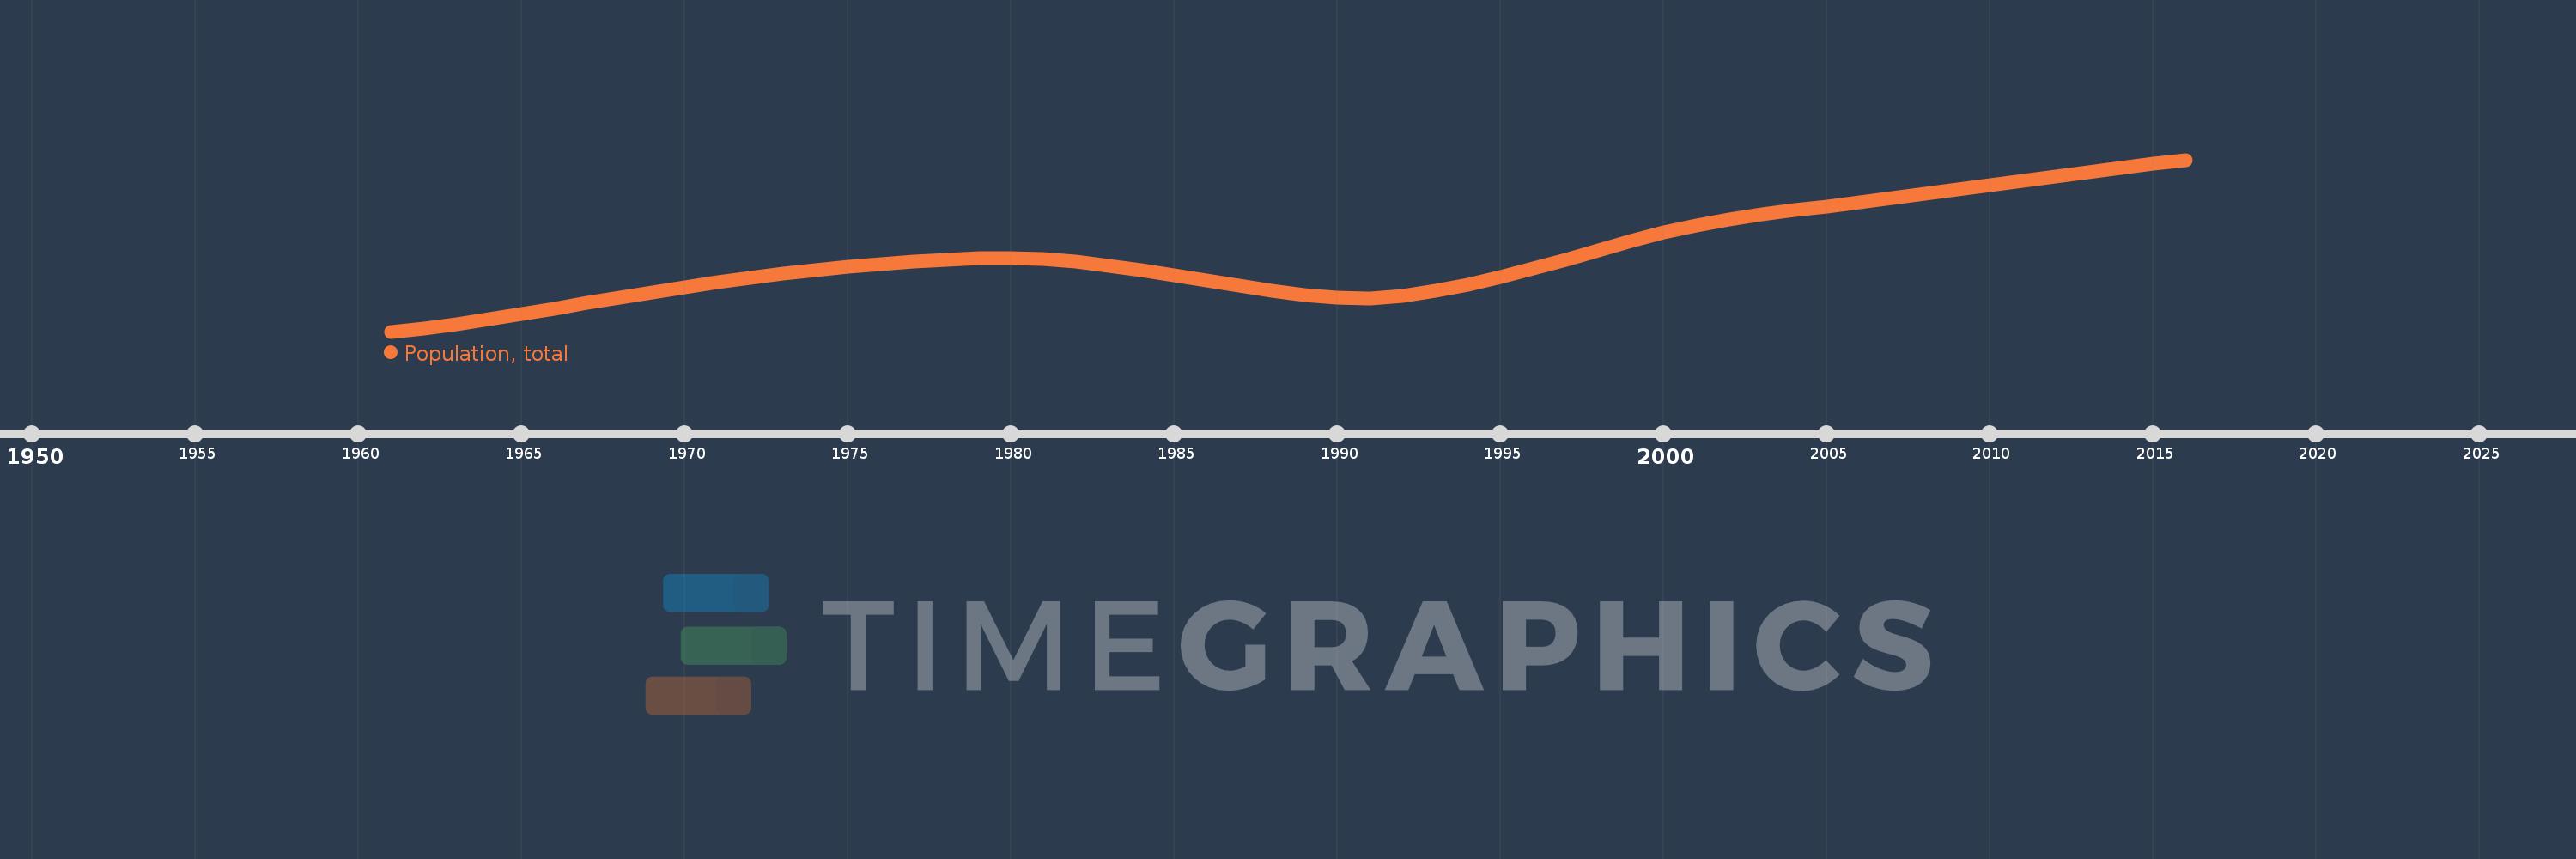
Population, total
2016,2015,2014,2013,2012,2011,2010,2009,2008,2007,2006,2005,2004,2003,2002,2001,2000,1999,1998,1997,1996,1995,1994,1993,1992,1991,1990,1989,1988,1987,1986,1985,1984,1983,1982,1981,1980,1979,1978,1977,1976,1975,1974,1973,1972,1971,1970,1969,1968,1967,1966,1965,1964,1963,1962,1961
Queste statistiche in altri paesi:
AfghanistanAlbaniaAlgeriaAmerican SamoaAndorraAngolaAntigua and BarbudaArab WorldArgentinaArmeniaArubaAustraliaAustriaAzerbaijanBahamas, TheBahrainBangladeshBarbadosBelarusBelgiumBelizeBeninBermudaBhutanBoliviaBosnia and HerzegovinaBotswanaBrazilBritish Virgin IslandsBrunei DarussalamBulgariaBurkina FasoBurundiCabo VerdeCambodiaCameroonCanadaCaribbean small statesCayman IslandsCentral African RepublicCentral Europe and the BalticsChadChannel IslandsChileChinaColombiaComorosCongo, Dem. Rep.Congo, Rep.Costa RicaCote d'IvoireCroatiaCubaCuracaoCyprusCzech RepublicDenmarkDjiboutiDominicaDominican RepublicEarly-demographic dividendEast Asia & PacificEast Asia & Pacific (excluding high income)East Asia & Pacific (IDA & IBRD countries)EcuadorEgypt, Arab Rep.El SalvadorEquatorial GuineaEritreaEstoniaEthiopiaEuro areaEurope & Central AsiaEurope & Central Asia (excluding high income)Europe & Central Asia (IDA & IBRD countries)European UnionFaroe IslandsFijiFinlandFragile and conflict affected situationsFranceFrench PolynesiaGabonGambia, TheGeorgiaGermanyGhanaGibraltarGreeceGreenlandGrenadaGuamGuatemalaGuineaGuinea-BissauGuyanaHaitiHeavily indebted poor countries (HIPC)High incomeHondurasHong Kong SAR, ChinaHungaryIBRD onlyIcelandIDA & IBRD totalIDA blendIDA onlyIDA totalIndiaIndonesiaIran, Islamic Rep.IraqIrelandIsle of ManIsraelItalyJamaicaJapanJordanKazakhstanKenyaKiribatiKorea, Dem. People’s Rep.Korea, Rep.KosovoKuwaitKyrgyz RepublicLao PDRLate-demographic dividendLatin America & Caribbean Latin America & Caribbean (excluding high income)Latin America & the Caribbean (IDA & IBRD countries)LatviaLeast developed countries: UN classificationLebanonLesothoLiberiaLibyaLiechtensteinLithuaniaLow & middle incomeLow incomeLower middle incomeLuxembourgMacao SAR, ChinaMacedonia, FYRMadagascarMalawiMalaysiaMaldivesMaliMaltaMarshall IslandsMauritaniaMauritiusMexicoMicronesia, Fed. Sts.Middle East & North AfricaMiddle East & North Africa (excluding high income)Middle East & North Africa (IDA & IBRD countries)Middle incomeMoldovaMonacoMongoliaMontenegroMoroccoMozambiqueMyanmarNamibiaNauruNepalNetherlandsNew CaledoniaNew ZealandNicaraguaNigerNigeriaNorth AmericaNorthern Mariana IslandsNorwayOECD membersOmanOther small statesPacific island small statesPakistanPalauPanamaPapua New GuineaParaguayPeruPhilippinesPolandPortugalPost-demographic dividendPre-demographic dividendPuerto RicoQatarRomaniaRussian FederationRwandaSamoaSan MarinoSao Tome and PrincipeSaudi ArabiaSenegalSerbiaSeychellesSierra LeoneSingaporeSint Maarten (Dutch part)Slovak RepublicSloveniaSmall statesSolomon IslandsSomaliaSouth AfricaSouth AsiaSouth Asia (IDA & IBRD)South SudanSpainSri LankaSt. Kitts and NevisSt. LuciaSt. Martin (French part)St. Vincent and the GrenadinesSub-Saharan Africa Sub-Saharan Africa (excluding high income)Sub-Saharan Africa (IDA & IBRD countries)SudanSurinameSwazilandSwedenSwitzerlandSyrian Arab RepublicTajikistanTanzaniaThailandTimor-LesteTogoTongaTrinidad and TobagoTunisiaTurkeyTurkmenistanTurks and Caicos IslandsTuvaluUgandaUkraineUnited Arab EmiratesUnited KingdomUnited StatesUpper middle incomeUruguayUzbekistanVanuatuVenezuela, RBVietnamVirgin Islands (U.S.)West Bank and GazaWorldYemen, Rep.ZambiaZimbabwe Linea del tempo:
Questa scala temporale mostra un grafico dal 1961 anno al 2016 anno. Antigua and Barbuda. I dati fino ad 1960 anno non disponibili. Il numero di osservazioni attuali secondo i date: 56.
La fonte (nome):
Indicatori dello sviluppo mondiale
La fonte (organizzazione):
(1) United Nations Population Division. World Population Prospects, (2) Census reports and other statistical publications from national statistical offices, (3) Eurostat: Demographic Statistics, (4) United Nations Statistical Division. Population and Vital Statistics Report (various years), (5) U.S. Census Bureau: International Database, and (6) Secretariat of the Pacific Community: Statistics and Demography Programme.
Categorie:
Climate Change, Health
sono stati aggiornati
23 apr 2017 anni
Indicatori delle variazioni dei valori per anni
Minima:
54.681 Mille.
1 gen 1961 anni
Massimo:
91.818 Mille.
1 gen 2016 anni
Alla data di osservazione
Valore
Variazione assoluta
La variazione rispetto al valore precedente
1 gen 1961 anni
54.681 Mille.
+54.681 Mille.
0.0%
1 gen 1962 anni
55.403 Mille.
+722.0
1.32%
1 gen 1963 anni
56.311 Mille.
+908.0
1.64%
1 gen 1964 anni
57.368 Mille.
+1.057 Mille.
1.88%
1 gen 1965 anni
58.5 Mille.
+1.132 Mille.
1.97%
1 gen 1966 anni
59.653 Mille.
+1.153 Mille.
1.97%
1 gen 1967 anni
60.818 Mille.
+1.165 Mille.
1.95%
1 gen 1968 anni
62.002 Mille.
+1.184 Mille.
1.95%
1 gen 1969 anni
63.176 Mille.
+1.174 Mille.
1.89%
1 gen 1970 anni
64.307 Mille.
+1.131 Mille.
1.79%
1 gen 1971 anni
65.369 Mille.
+1.062 Mille.
1.65%
1 gen 1972 anni
66.338 Mille.
+969.0
1.48%
1 gen 1973 anni
67.205 Mille.
+867.0
1.31%
1 gen 1974 anni
67.972 Mille.
+767.0
1.14%
1 gen 1975 anni
68.655 Mille.
+683.0
1.0%
1 gen 1976 anni
69.253 Mille.
+598.0
0.87%
1 gen 1977 anni
69.782 Mille.
+529.0
0.76%
1 gen 1978 anni
70.223 Mille.
+441.0
0.63%
1 gen 1979 anni
70.508 Mille.
+285.0
0.41%
1 gen 1980 anni
70.553 Mille.
+45.0
0.06%
1 gen 1981 anni
70.301 Mille.
-252.0
-0.36%
1 gen 1982 anni
69.75 Mille.
-551.0
-0.78%
1 gen 1983 anni
68.95 Mille.
-800.0
-1.15%
1 gen 1984 anni
67.958 Mille.
-992.0
-1.44%
1 gen 1985 anni
66.863 Mille.
-1.095 Mille.
-1.61%
1 gen 1986 anni
65.744 Mille.
-1.119 Mille.
-1.67%
1 gen 1987 anni
64.605 Mille.
-1.139 Mille.
-1.73%
1 gen 1988 anni
63.484 Mille.
-1.121 Mille.
-1.74%
1 gen 1989 anni
62.538 Mille.
-946.0
-1.49%
1 gen 1990 anni
61.967 Mille.
-571.0
-0.91%
1 gen 1991 anni
61.906 Mille.
-61.0
-0.1%
1 gen 1992 anni
62.412 Mille.
+506.0
0.82%
1 gen 1993 anni
63.434 Mille.
+1.022 Mille.
1.64%
1 gen 1994 anni
64.868 Mille.
+1.434 Mille.
2.26%
1 gen 1995 anni
66.55 Mille.
+1.682 Mille.
2.59%
1 gen 1996 anni
68.349 Mille.
+1.799 Mille.
2.7%
1 gen 1997 anni
70.245 Mille.
+1.896 Mille.
2.77%
1 gen 1998 anni
72.232 Mille.
+1.987 Mille.
2.83%
1 gen 1999 anni
74.206 Mille.
+1.974 Mille.
2.73%
1 gen 2000 anni
76.041 Mille.
+1.835 Mille.
2.47%
1 gen 2001 anni
77.648 Mille.
+1.607 Mille.
2.11%
1 gen 2002 anni
78.972 Mille.
+1.324 Mille.
1.71%
1 gen 2003 anni
80.03 Mille.
+1.058 Mille.
1.34%
1 gen 2004 anni
80.904 Mille.
+874.0
1.09%
1 gen 2005 anni
81.718 Mille.
+814.0
1.01%
1 gen 2006 anni
82.565 Mille.
+847.0
1.04%
1 gen 2007 anni
83.467 Mille.
+902.0
1.09%
1 gen 2008 anni
84.397 Mille.
+930.0
1.11%
1 gen 2009 anni
85.35 Mille.
+953.0
1.13%
1 gen 2010 anni
86.3 Mille.
+950.0
1.11%
1 gen 2011 anni
87.233 Mille.
+933.0
1.08%
1 gen 2012 anni
88.152 Mille.
+919.0
1.05%
1 gen 2013 anni
89.069 Mille.
+917.0
1.04%
1 gen 2014 anni
89.985 Mille.
+916.0
1.03%
1 gen 2015 anni
90.9 Mille.
+915.0
1.02%
1 gen 2016 anni
91.818 Mille.
+918.0
1.01%
Classificazione dei paesi secondo i statistiche attuali per anni


Commenti: