29
/it/
it
AIzaSyAYiBZKx7MnpbEhh9jyipgxe19OcubqV5w
April 1, 2024
194740
Mauritius
MUS
true
2
1
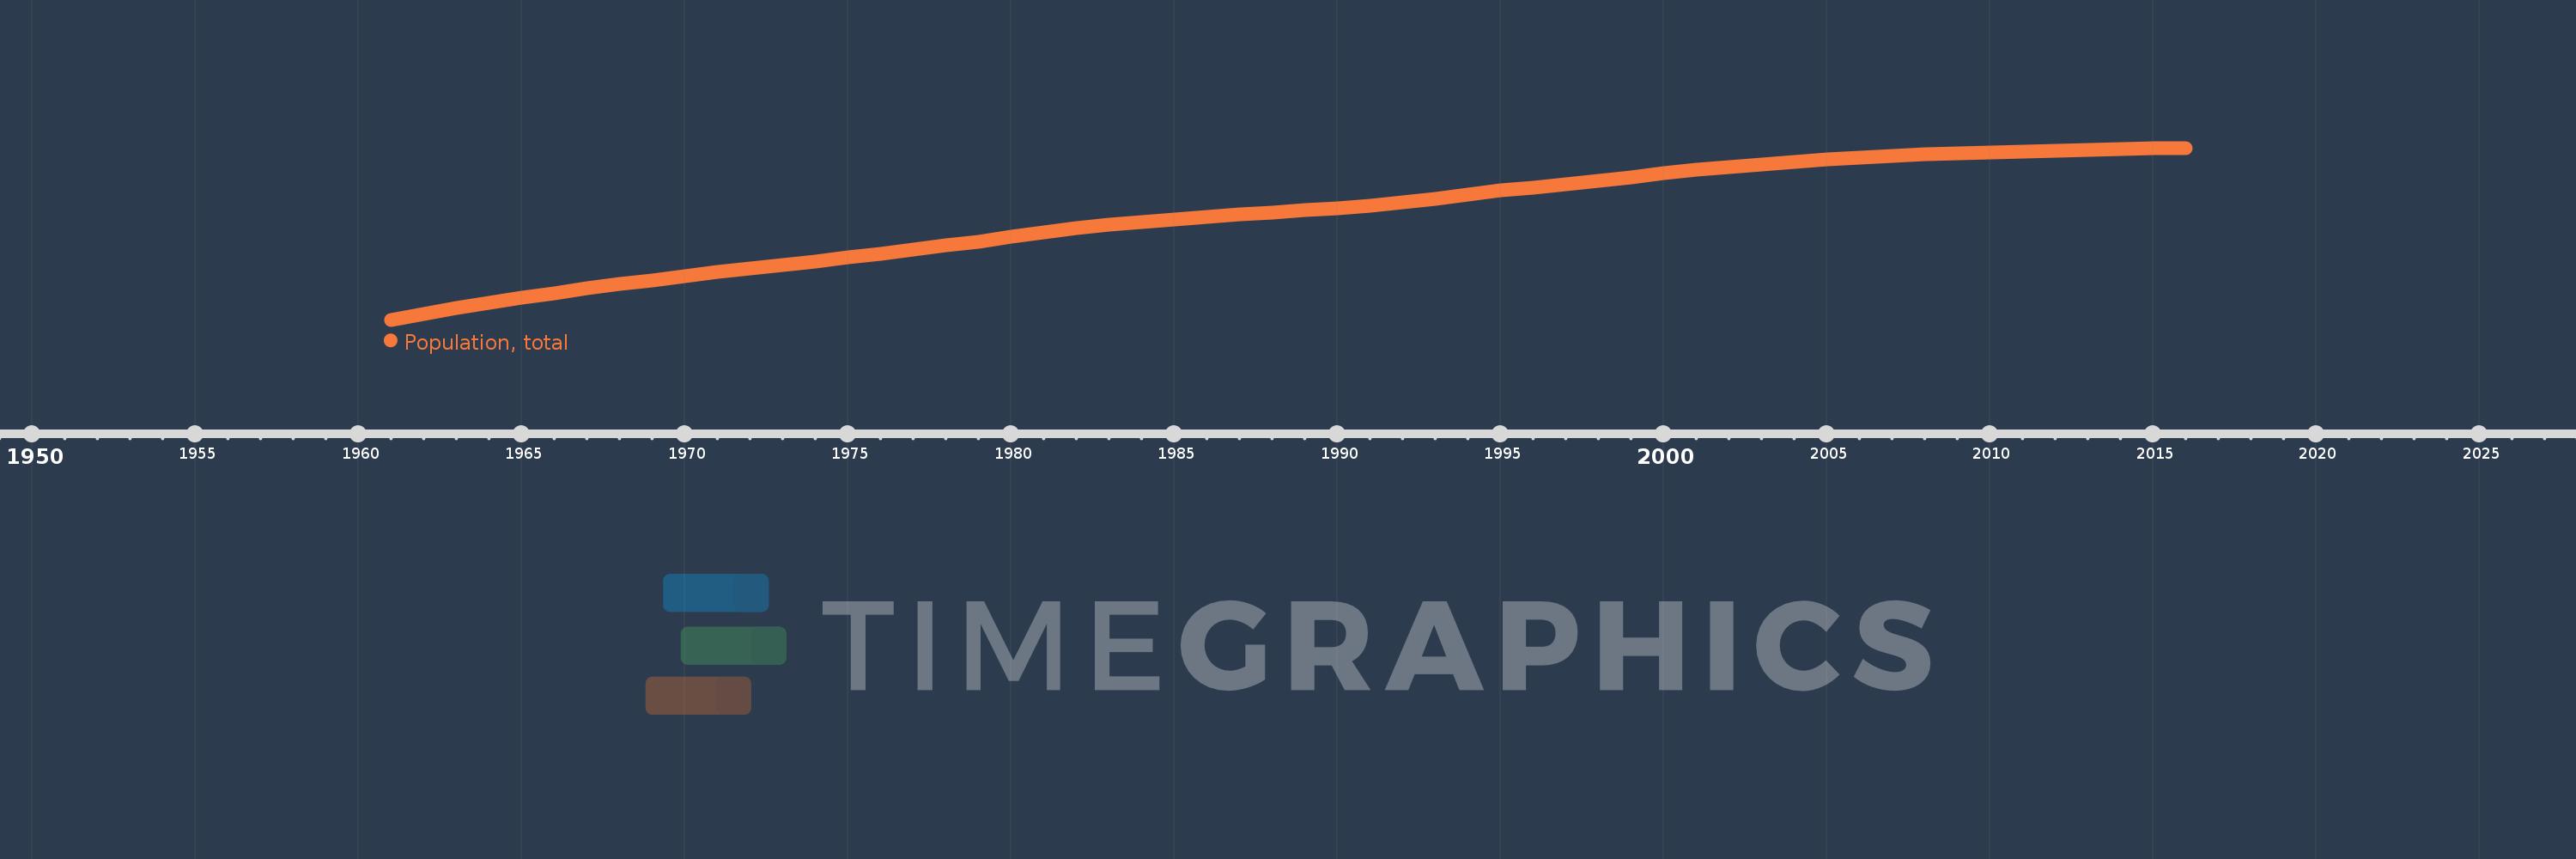
Population, total
2016,2015,2014,2013,2012,2011,2010,2009,2008,2007,2006,2005,2004,2003,2002,2001,2000,1999,1998,1997,1996,1995,1994,1993,1992,1991,1990,1989,1988,1987,1986,1985,1984,1983,1982,1981,1980,1979,1978,1977,1976,1975,1974,1973,1972,1971,1970,1969,1968,1967,1966,1965,1964,1963,1962,1961
Queste statistiche in altri paesi:
AfghanistanAlbaniaAlgeriaAmerican SamoaAndorraAngolaAntigua and BarbudaArab WorldArgentinaArmeniaArubaAustraliaAustriaAzerbaijanBahamas, TheBahrainBangladeshBarbadosBelarusBelgiumBelizeBeninBermudaBhutanBoliviaBosnia and HerzegovinaBotswanaBrazilBritish Virgin IslandsBrunei DarussalamBulgariaBurkina FasoBurundiCabo VerdeCambodiaCameroonCanadaCaribbean small statesCayman IslandsCentral African RepublicCentral Europe and the BalticsChadChannel IslandsChileChinaColombiaComorosCongo, Dem. Rep.Congo, Rep.Costa RicaCote d'IvoireCroatiaCubaCuracaoCyprusCzech RepublicDenmarkDjiboutiDominicaDominican RepublicEarly-demographic dividendEast Asia & PacificEast Asia & Pacific (excluding high income)East Asia & Pacific (IDA & IBRD countries)EcuadorEgypt, Arab Rep.El SalvadorEquatorial GuineaEritreaEstoniaEthiopiaEuro areaEurope & Central AsiaEurope & Central Asia (excluding high income)Europe & Central Asia (IDA & IBRD countries)European UnionFaroe IslandsFijiFinlandFragile and conflict affected situationsFranceFrench PolynesiaGabonGambia, TheGeorgiaGermanyGhanaGibraltarGreeceGreenlandGrenadaGuamGuatemalaGuineaGuinea-BissauGuyanaHaitiHeavily indebted poor countries (HIPC)High incomeHondurasHong Kong SAR, ChinaHungaryIBRD onlyIcelandIDA & IBRD totalIDA blendIDA onlyIDA totalIndiaIndonesiaIran, Islamic Rep.IraqIrelandIsle of ManIsraelItalyJamaicaJapanJordanKazakhstanKenyaKiribatiKorea, Dem. People’s Rep.Korea, Rep.KosovoKuwaitKyrgyz RepublicLao PDRLate-demographic dividendLatin America & Caribbean Latin America & Caribbean (excluding high income)Latin America & the Caribbean (IDA & IBRD countries)LatviaLeast developed countries: UN classificationLebanonLesothoLiberiaLibyaLiechtensteinLithuaniaLow & middle incomeLow incomeLower middle incomeLuxembourgMacao SAR, ChinaMacedonia, FYRMadagascarMalawiMalaysiaMaldivesMaliMaltaMarshall IslandsMauritaniaMauritiusMexicoMicronesia, Fed. Sts.Middle East & North AfricaMiddle East & North Africa (excluding high income)Middle East & North Africa (IDA & IBRD countries)Middle incomeMoldovaMonacoMongoliaMontenegroMoroccoMozambiqueMyanmarNamibiaNauruNepalNetherlandsNew CaledoniaNew ZealandNicaraguaNigerNigeriaNorth AmericaNorthern Mariana IslandsNorwayOECD membersOmanOther small statesPacific island small statesPakistanPalauPanamaPapua New GuineaParaguayPeruPhilippinesPolandPortugalPost-demographic dividendPre-demographic dividendPuerto RicoQatarRomaniaRussian FederationRwandaSamoaSan MarinoSao Tome and PrincipeSaudi ArabiaSenegalSerbiaSeychellesSierra LeoneSingaporeSint Maarten (Dutch part)Slovak RepublicSloveniaSmall statesSolomon IslandsSomaliaSouth AfricaSouth AsiaSouth Asia (IDA & IBRD)South SudanSpainSri LankaSt. Kitts and NevisSt. LuciaSt. Martin (French part)St. Vincent and the GrenadinesSub-Saharan Africa Sub-Saharan Africa (excluding high income)Sub-Saharan Africa (IDA & IBRD countries)SudanSurinameSwazilandSwedenSwitzerlandSyrian Arab RepublicTajikistanTanzaniaThailandTimor-LesteTogoTongaTrinidad and TobagoTunisiaTurkeyTurkmenistanTurks and Caicos IslandsTuvaluUgandaUkraineUnited Arab EmiratesUnited KingdomUnited StatesUpper middle incomeUruguayUzbekistanVanuatuVenezuela, RBVietnamVirgin Islands (U.S.)West Bank and GazaWorldYemen, Rep.ZambiaZimbabwe Linea del tempo:
Questa scala temporale mostra un grafico dal 1961 anno al 2016 anno. Mauritius. I dati fino ad 1960 anno non disponibili. Il numero di osservazioni attuali secondo i date: 56.
La fonte (nome):
Indicatori dello sviluppo mondiale
La fonte (organizzazione):
(1) United Nations Population Division. World Population Prospects, (2) Census reports and other statistical publications from national statistical offices, (3) Eurostat: Demographic Statistics, (4) United Nations Statistical Division. Population and Vital Statistics Report (various years), (5) U.S. Census Bureau: International Database, and (6) Secretariat of the Pacific Community: Statistics and Demography Programme.
Categorie:
Climate Change, Health
sono stati aggiornati
23 apr 2017 anni
Indicatori delle variazioni dei valori per anni
Minima:
659.351 Mille.
1 gen 1961 anni
Massimo:
1.263 Mln
1 gen 2016 anni
Alla data di osservazione
Valore
Variazione assoluta
La variazione rispetto al valore precedente
1 gen 1961 anni
659.351 Mille.
+659.351 Mille.
0.0%
1 gen 1962 anni
680.757 Mille.
+21.406 Mille.
3.25%
1 gen 1963 anni
700.349 Mille.
+19.592 Mille.
2.88%
1 gen 1964 anni
718.861 Mille.
+18.512 Mille.
2.64%
1 gen 1965 anni
736.381 Mille.
+17.52 Mille.
2.44%
1 gen 1966 anni
753.0 Mille.
+16.619 Mille.
2.26%
1 gen 1967 anni
768.813 Mille.
+15.813 Mille.
2.1%
1 gen 1968 anni
783.917 Mille.
+15.104 Mille.
1.96%
1 gen 1969 anni
798.413 Mille.
+14.496 Mille.
1.85%
1 gen 1970 anni
812.405 Mille.
+13.992 Mille.
1.75%
1 gen 1971 anni
826.0 Mille.
+13.595 Mille.
1.67%
1 gen 1972 anni
839.23 Mille.
+13.23 Mille.
1.6%
1 gen 1973 anni
852.053 Mille.
+12.823 Mille.
1.53%
1 gen 1974 anni
864.819 Mille.
+12.766 Mille.
1.5%
1 gen 1975 anni
878.042 Mille.
+13.223 Mille.
1.53%
1 gen 1976 anni
892.0 Mille.
+13.958 Mille.
1.59%
1 gen 1977 anni
906.507 Mille.
+14.507 Mille.
1.63%
1 gen 1978 anni
921.379 Mille.
+14.872 Mille.
1.64%
1 gen 1979 anni
933.499 Mille.
+12.12 Mille.
1.32%
1 gen 1980 anni
949.888 Mille.
+16.389 Mille.
1.76%
1 gen 1981 anni
966.039 Mille.
+16.151 Mille.
1.7%
1 gen 1982 anni
980.462 Mille.
+14.423 Mille.
1.49%
1 gen 1983 anni
992.521 Mille.
+12.059 Mille.
1.23%
1 gen 1984 anni
1.002 Mln
+9.17 Mille.
0.92%
1 gen 1985 anni
1.012 Mln
+10.53 Mille.
1.05%
1 gen 1986 anni
1.021 Mln
+8.307 Mille.
0.82%
1 gen 1987 anni
1.028 Mln
+7.832 Mille.
0.77%
1 gen 1988 anni
1.036 Mln
+7.722 Mille.
0.75%
1 gen 1989 anni
1.043 Mln
+7.157 Mille.
0.69%
1 gen 1990 anni
1.051 Mln
+8.021 Mille.
0.77%
1 gen 1991 anni
1.059 Mln
+7.515 Mille.
0.71%
1 gen 1992 anni
1.07 Mln
+11.491 Mille.
1.09%
1 gen 1993 anni
1.084 Mln
+14.175 Mille.
1.32%
1 gen 1994 anni
1.097 Mln
+12.933 Mille.
1.19%
1 gen 1995 anni
1.113 Mln
+15.472 Mille.
1.41%
1 gen 1996 anni
1.122 Mln
+9.611 Mille.
0.86%
1 gen 1997 anni
1.134 Mln
+11.539 Mille.
1.03%
1 gen 1998 anni
1.148 Mln
+14.288 Mille.
1.26%
1 gen 1999 anni
1.16 Mln
+12.137 Mille.
1.06%
1 gen 2000 anni
1.175 Mln
+14.846 Mille.
1.28%
1 gen 2001 anni
1.187 Mln
+11.606 Mille.
0.99%
1 gen 2002 anni
1.196 Mln
+9.414 Mille.
0.79%
1 gen 2003 anni
1.205 Mln
+8.334 Mille.
0.7%
1 gen 2004 anni
1.213 Mln
+8.749 Mille.
0.73%
1 gen 2005 anni
1.221 Mln
+7.633 Mille.
0.63%
1 gen 2006 anni
1.228 Mln
+7.251 Mille.
0.59%
1 gen 2007 anni
1.234 Mln
+5.742 Mille.
0.47%
1 gen 2008 anni
1.24 Mln
+5.634 Mille.
0.46%
1 gen 2009 anni
1.244 Mln
+4.491 Mille.
0.36%
1 gen 2010 anni
1.247 Mln
+3.308 Mille.
0.27%
1 gen 2011 anni
1.25 Mln
+2.971 Mille.
0.24%
1 gen 2012 anni
1.252 Mln
+2.004 Mille.
0.16%
1 gen 2013 anni
1.256 Mln
+3.478 Mille.
0.28%
1 gen 2014 anni
1.259 Mln
+2.771 Mille.
0.22%
1 gen 2015 anni
1.261 Mln
+2.281 Mille.
0.18%
1 gen 2016 anni
1.263 Mln
+1.671 Mille.
0.13%
Classificazione dei paesi secondo i statistiche attuali per anni


Commenti: