29
/it/
it
AIzaSyAYiBZKx7MnpbEhh9jyipgxe19OcubqV5w
April 1, 2024
65671
Algeria
DZA
true
2
1
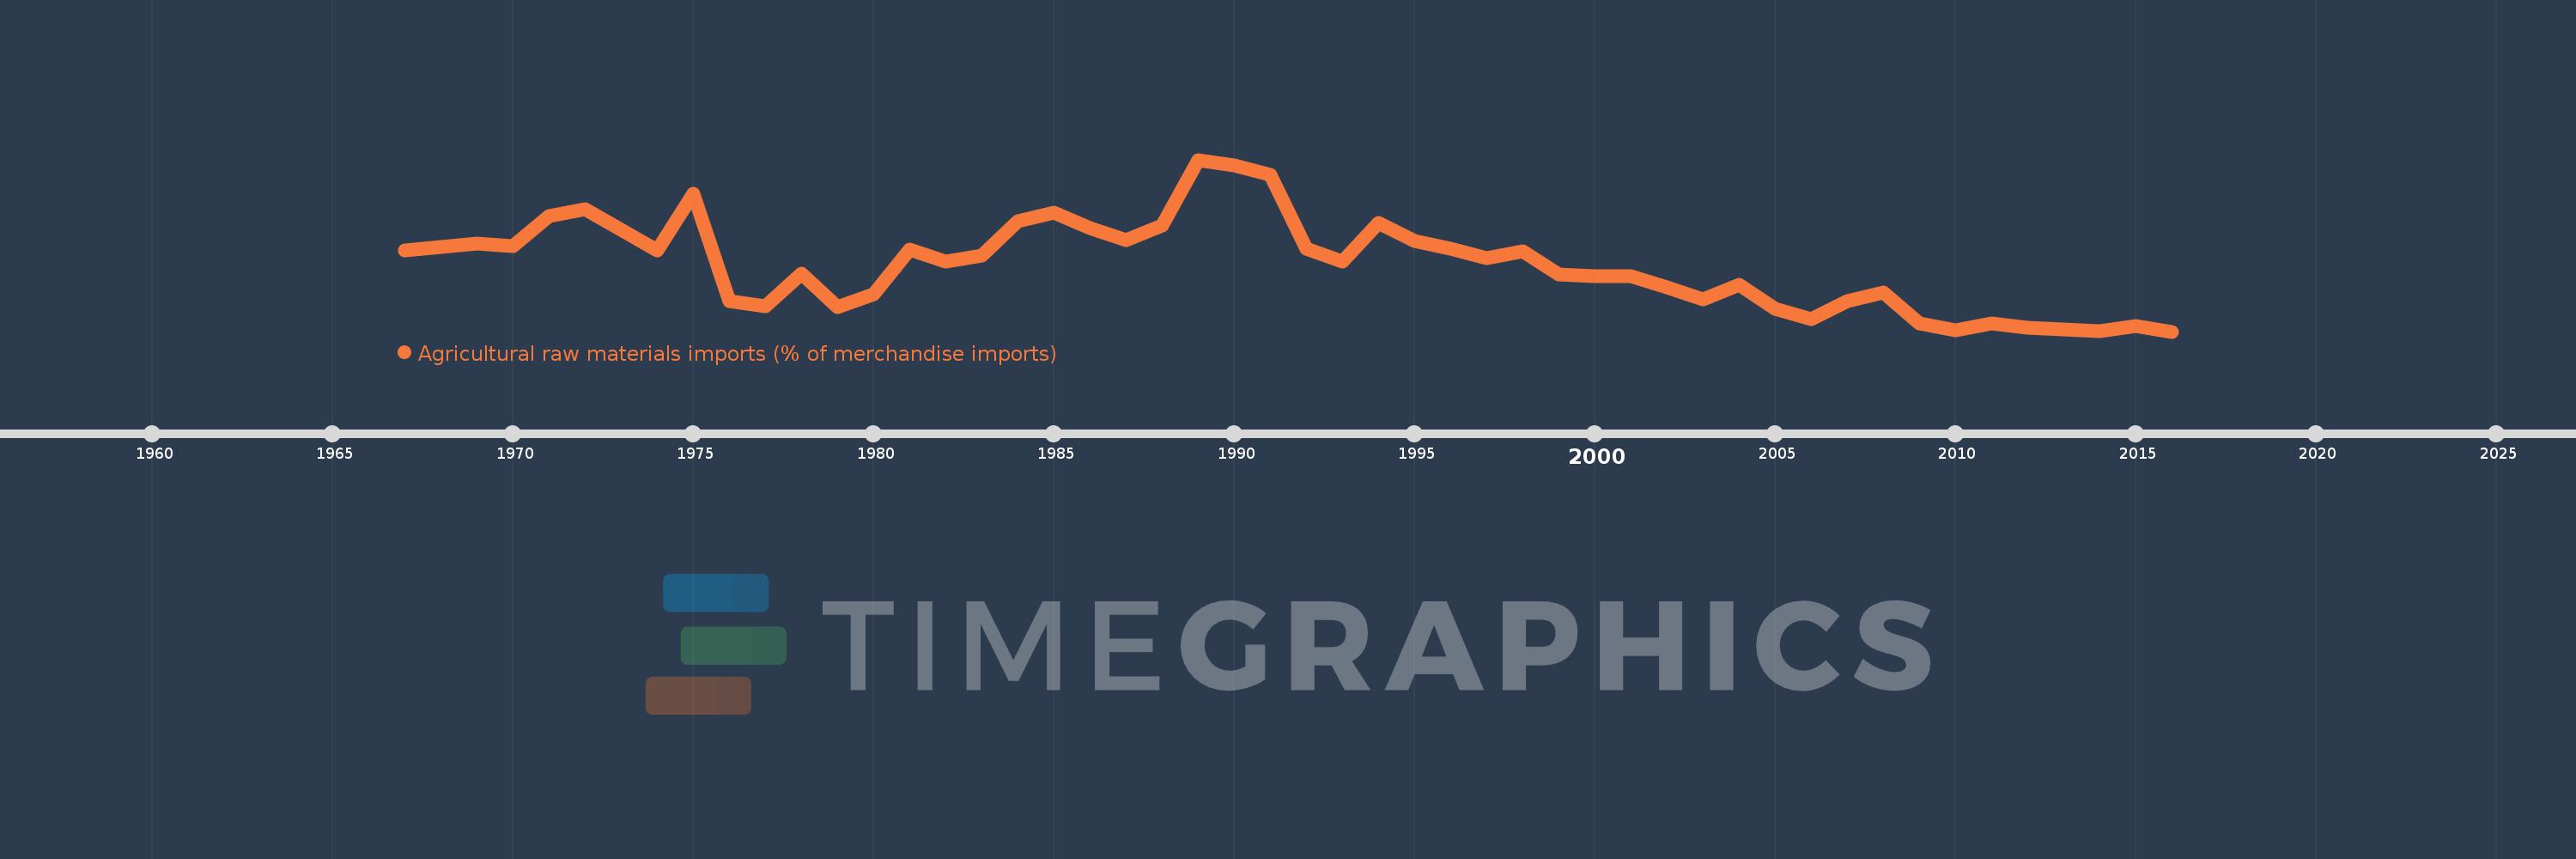
Agricultural raw materials imports (% of merchandise imports)
2016,2015,2014,2013,2012,2011,2010,2009,2008,2007,2006,2005,2004,2003,2002,2001,2000,1999,1998,1997,1996,1995,1994,1993,1992,1991,1990,1989,1988,1987,1986,1985,1984,1983,1982,1981,1980,1979,1978,1977,1976,1975,1974,1972,1971,1970,1969,1967
Queste statistiche in altri paesi:
AfghanistanAlbaniaAlgeriaAndorraAngolaAntigua and BarbudaArab WorldArgentinaArmeniaArubaAustraliaAustriaAzerbaijanBahamas, TheBahrainBangladeshBarbadosBelarusBelgiumBelizeBeninBermudaBhutanBoliviaBosnia and HerzegovinaBotswanaBrazilBrunei DarussalamBulgariaBurkina FasoBurundiCabo VerdeCambodiaCameroonCanadaCaribbean small statesCayman IslandsCentral African RepublicCentral Europe and the BalticsChadChileChinaColombiaComorosCongo, Dem. Rep.Congo, Rep.Costa RicaCote d'IvoireCroatiaCubaCyprusCzech RepublicDenmarkDjiboutiDominicaDominican RepublicEarly-demographic dividendEast Asia & PacificEast Asia & Pacific (excluding high income)East Asia & Pacific (IDA & IBRD countries)EcuadorEgypt, Arab Rep.El SalvadorEquatorial GuineaEritreaEstoniaEthiopiaEuro areaEurope & Central AsiaEurope & Central Asia (excluding high income)Europe & Central Asia (IDA & IBRD countries)European UnionFaroe IslandsFijiFinlandFragile and conflict affected situationsFranceFrench PolynesiaGabonGambia, TheGeorgiaGermanyGhanaGreeceGreenlandGrenadaGuatemalaGuineaGuinea-BissauGuyanaHaitiHeavily indebted poor countries (HIPC)High incomeHondurasHong Kong SAR, ChinaHungaryIBRD onlyIcelandIDA & IBRD totalIDA blendIDA onlyIDA totalIndiaIndonesiaIran, Islamic Rep.IraqIrelandIsraelItalyJamaicaJapanJordanKazakhstanKenyaKiribatiKorea, Rep.KuwaitKyrgyz RepublicLao PDRLate-demographic dividendLatin America & Caribbean Latin America & Caribbean (excluding high income)Latin America & the Caribbean (IDA & IBRD countries)LatviaLeast developed countries: UN classificationLebanonLesothoLiberiaLibyaLithuaniaLow & middle incomeLow incomeLower middle incomeLuxembourgMacao SAR, ChinaMacedonia, FYRMadagascarMalawiMalaysiaMaldivesMaliMaltaMauritaniaMauritiusMexicoMiddle East & North AfricaMiddle East & North Africa (excluding high income)Middle East & North Africa (IDA & IBRD countries)Middle incomeMoldovaMongoliaMoroccoMozambiqueMyanmarNamibiaNepalNetherlandsNew CaledoniaNew ZealandNicaraguaNigerNigeriaNorth AmericaNorwayOECD membersOmanOther small statesPacific island small statesPakistanPalauPanamaPapua New GuineaParaguayPeruPhilippinesPolandPortugalPost-demographic dividendPre-demographic dividendQatarRomaniaRussian FederationRwandaSamoaSao Tome and PrincipeSaudi ArabiaSenegalSerbiaSeychellesSierra LeoneSingaporeSlovak RepublicSloveniaSmall statesSolomon IslandsSomaliaSouth AfricaSouth AsiaSouth Asia (IDA & IBRD)SpainSri LankaSt. Kitts and NevisSt. LuciaSt. Vincent and the GrenadinesSub-Saharan Africa Sub-Saharan Africa (excluding high income)Sub-Saharan Africa (IDA & IBRD countries)SudanSurinameSwazilandSwedenSwitzerlandSyrian Arab RepublicTajikistanTanzaniaThailandTimor-LesteTogoTongaTrinidad and TobagoTunisiaTurkeyTurkmenistanTurks and Caicos IslandsTuvaluUgandaUkraineUnited Arab EmiratesUnited KingdomUnited StatesUpper middle incomeUruguayVanuatuVenezuela, RBVietnamVirgin Islands (U.S.)WorldYemen, Rep.ZambiaZimbabwe Linea del tempo:
Questa scala temporale mostra un grafico dal 1967 anno al 2016 anno. Algeria. I dati fino ad 1966 anno non disponibili. Il numero di osservazioni attuali secondo i date: 48.
La fonte (nome):
Indicatori dello sviluppo mondiale
La fonte (organizzazione):
World Bank staff estimates from the Comtrade database maintained by the United Nations Statistics Division.
Categorie:
Agriculture & Rural Development, Private Sector, Trade
sono stati aggiornati
23 apr 2017 anni
Indicatori delle variazioni dei valori per anni
Minima:
1.441
1 gen 2016 anni
Massimo:
5.024
1 gen 1989 anni
Alla data di osservazione
Valore
Variazione assoluta
La variazione rispetto al valore precedente
1 gen 1967 anni
3.126
+3.126
0.0%
1 gen 1969 anni
3.286
+0.161
5.14%
1 gen 1970 anni
3.227
-0.059
-1.79%
1 gen 1971 anni
3.849
+0.622
19.27%
1 gen 1972 anni
3.988
+0.139
3.6%
1 gen 1974 anni
3.139
-0.849
-21.29%
1 gen 1975 anni
4.309
+1.17
37.28%
1 gen 1976 anni
2.077
-2.232
-51.8%
1 gen 1977 anni
1.961
-0.116
-5.58%
1 gen 1978 anni
2.658
+0.697
35.55%
1 gen 1979 anni
1.953
-0.705
-26.52%
1 gen 1980 anni
2.221
+0.268
13.71%
1 gen 1981 anni
3.153
+0.932
41.97%
1 gen 1982 anni
2.901
-0.252
-8.01%
1 gen 1983 anni
3.032
+0.131
4.51%
1 gen 1984 anni
3.74
+0.708
23.37%
1 gen 1985 anni
3.924
+0.184
4.91%
1 gen 1986 anni
3.602
-0.322
-8.21%
1 gen 1987 anni
3.353
-0.249
-6.91%
1 gen 1988 anni
3.662
+0.309
9.2%
1 gen 1989 anni
5.024
+1.363
37.22%
1 gen 1990 anni
4.906
-0.118
-2.35%
1 gen 1991 anni
4.718
-0.188
-3.83%
1 gen 1992 anni
3.178
-1.541
-32.66%
1 gen 1993 anni
2.907
-0.27
-8.51%
1 gen 1994 anni
3.7
+0.792
27.25%
1 gen 1995 anni
3.337
-0.362
-9.79%
1 gen 1996 anni
3.177
-0.16
-4.8%
1 gen 1997 anni
2.981
-0.196
-6.15%
1 gen 1998 anni
3.124
+0.142
4.77%
1 gen 1999 anni
2.625
-0.499
-15.96%
1 gen 2000 anni
2.589
-0.036
-1.37%
1 gen 2001 anni
2.594
+0.005
0.2%
1 gen 2002 anni
2.358
-0.237
-9.12%
1 gen 2003 anni
2.115
-0.242
-10.27%
1 gen 2004 anni
2.412
+0.296
14.01%
1 gen 2005 anni
1.91
-0.502
-20.82%
1 gen 2006 anni
1.698
-0.212
-11.1%
1 gen 2007 anni
2.081
+0.383
22.56%
1 gen 2008 anni
2.257
+0.176
8.48%
1 gen 2009 anni
1.609
-0.648
-28.7%
1 gen 2010 anni
1.463
-0.147
-9.11%
1 gen 2011 anni
1.607
+0.145
9.89%
1 gen 2012 anni
1.515
-0.092
-5.72%
1 gen 2013 anni
1.481
-0.035
-2.28%
1 gen 2014 anni
1.443
-0.038
-2.58%
1 gen 2015 anni
1.563
+0.12
8.32%
1 gen 2016 anni
1.441
-0.122
-7.81%
Classificazione dei paesi secondo i statistiche attuali per anni


Commenti: