29
/it/
it
AIzaSyAYiBZKx7MnpbEhh9jyipgxe19OcubqV5w
April 1, 2024
24668
Caribbean small states
CSS
false
2
1
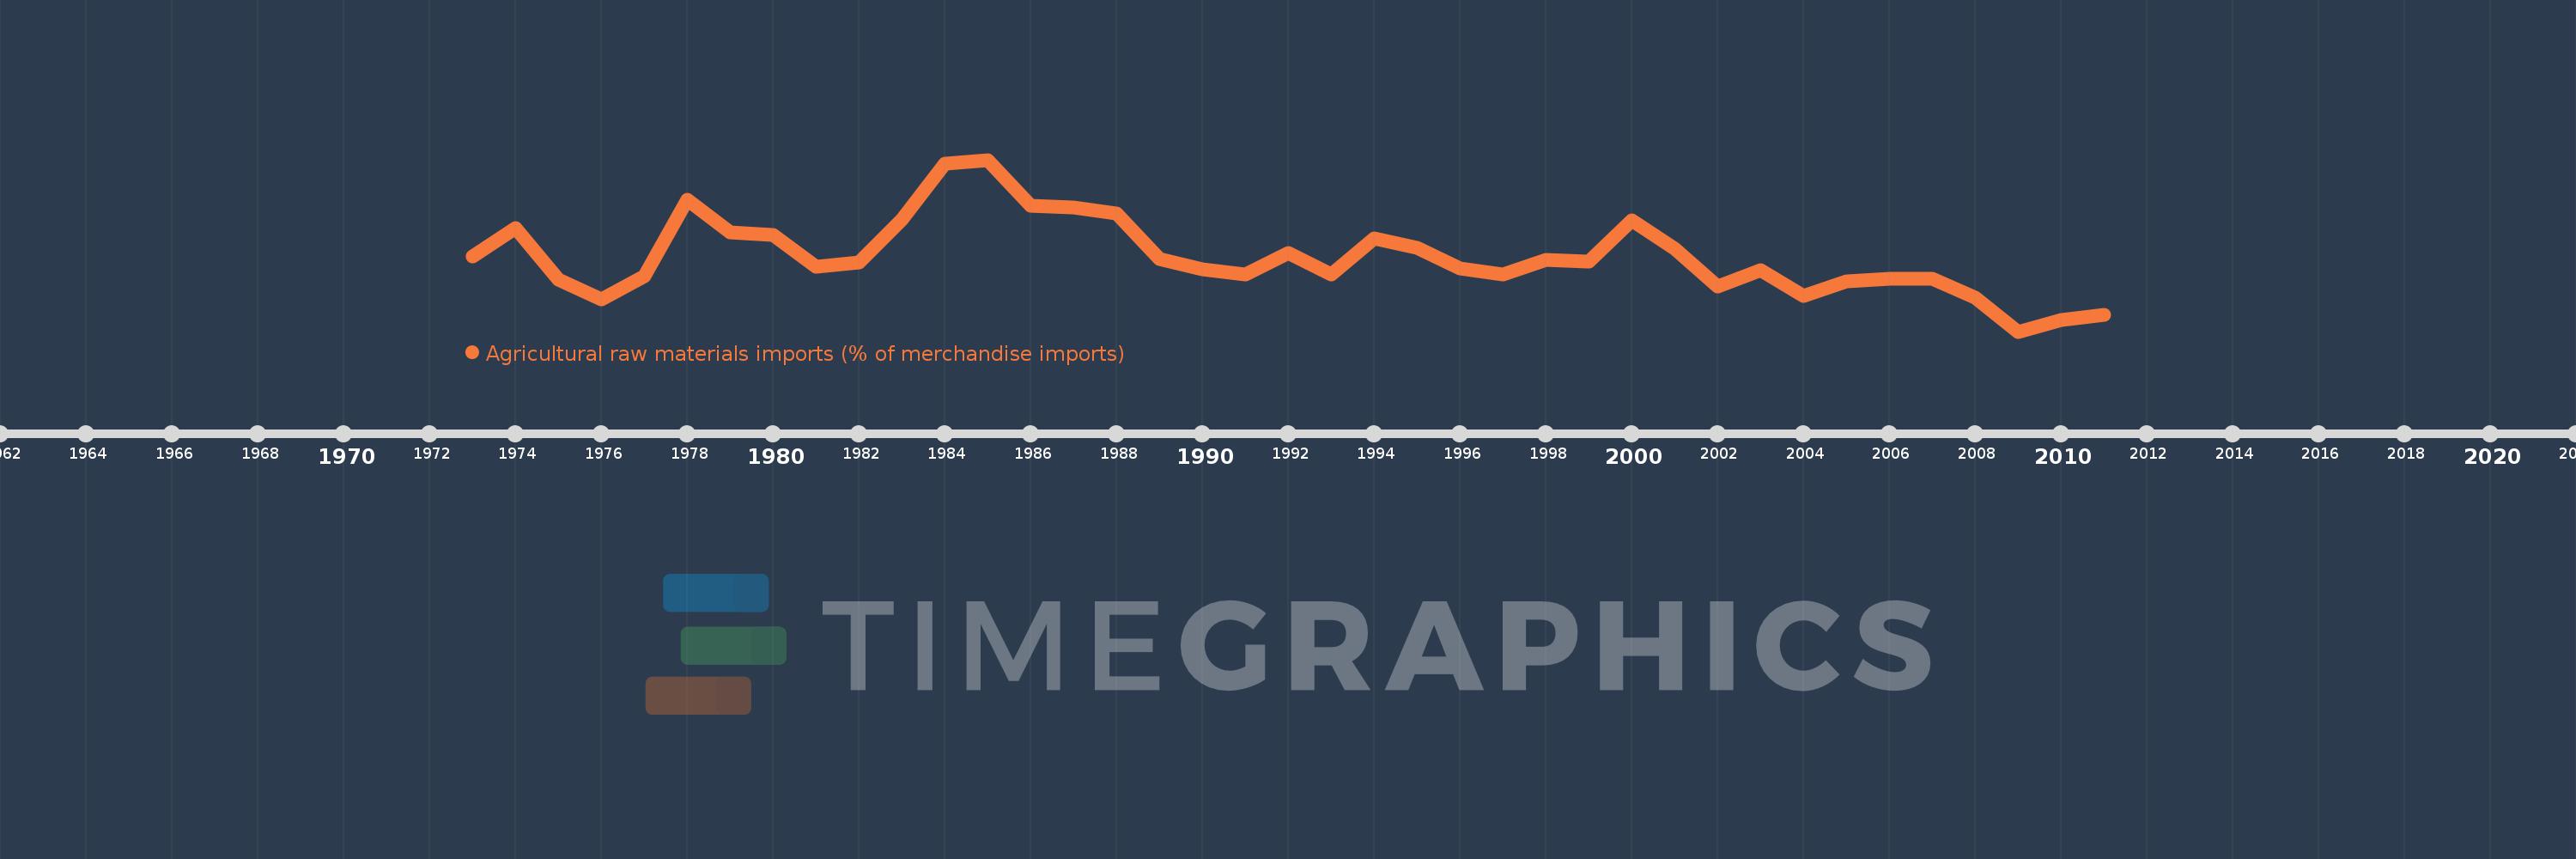
Agricultural raw materials imports (% of merchandise imports)
2011,2010,2009,2008,2007,2006,2005,2004,2003,2002,2001,2000,1999,1998,1997,1996,1995,1994,1993,1992,1991,1990,1989,1988,1987,1986,1985,1984,1983,1982,1981,1980,1979,1978,1977,1976,1975,1974,1973
Queste statistiche in altri paesi:
AfghanistanAlbaniaAlgeriaAndorraAngolaAntigua and BarbudaArab WorldArgentinaArmeniaArubaAustraliaAustriaAzerbaijanBahamas, TheBahrainBangladeshBarbadosBelarusBelgiumBelizeBeninBermudaBhutanBoliviaBosnia and HerzegovinaBotswanaBrazilBrunei DarussalamBulgariaBurkina FasoBurundiCabo VerdeCambodiaCameroonCanadaCaribbean small statesCayman IslandsCentral African RepublicCentral Europe and the BalticsChadChileChinaColombiaComorosCongo, Dem. Rep.Congo, Rep.Costa RicaCote d'IvoireCroatiaCubaCyprusCzech RepublicDenmarkDjiboutiDominicaDominican RepublicEarly-demographic dividendEast Asia & PacificEast Asia & Pacific (excluding high income)East Asia & Pacific (IDA & IBRD countries)EcuadorEgypt, Arab Rep.El SalvadorEquatorial GuineaEritreaEstoniaEthiopiaEuro areaEurope & Central AsiaEurope & Central Asia (excluding high income)Europe & Central Asia (IDA & IBRD countries)European UnionFaroe IslandsFijiFinlandFragile and conflict affected situationsFranceFrench PolynesiaGabonGambia, TheGeorgiaGermanyGhanaGreeceGreenlandGrenadaGuatemalaGuineaGuinea-BissauGuyanaHaitiHeavily indebted poor countries (HIPC)High incomeHondurasHong Kong SAR, ChinaHungaryIBRD onlyIcelandIDA & IBRD totalIDA blendIDA onlyIDA totalIndiaIndonesiaIran, Islamic Rep.IraqIrelandIsraelItalyJamaicaJapanJordanKazakhstanKenyaKiribatiKorea, Rep.KuwaitKyrgyz RepublicLao PDRLate-demographic dividendLatin America & Caribbean Latin America & Caribbean (excluding high income)Latin America & the Caribbean (IDA & IBRD countries)LatviaLeast developed countries: UN classificationLebanonLesothoLiberiaLibyaLithuaniaLow & middle incomeLow incomeLower middle incomeLuxembourgMacao SAR, ChinaMacedonia, FYRMadagascarMalawiMalaysiaMaldivesMaliMaltaMauritaniaMauritiusMexicoMiddle East & North AfricaMiddle East & North Africa (excluding high income)Middle East & North Africa (IDA & IBRD countries)Middle incomeMoldovaMongoliaMoroccoMozambiqueMyanmarNamibiaNepalNetherlandsNew CaledoniaNew ZealandNicaraguaNigerNigeriaNorth AmericaNorwayOECD membersOmanOther small statesPacific island small statesPakistanPalauPanamaPapua New GuineaParaguayPeruPhilippinesPolandPortugalPost-demographic dividendPre-demographic dividendQatarRomaniaRussian FederationRwandaSamoaSao Tome and PrincipeSaudi ArabiaSenegalSerbiaSeychellesSierra LeoneSingaporeSlovak RepublicSloveniaSmall statesSolomon IslandsSomaliaSouth AfricaSouth AsiaSouth Asia (IDA & IBRD)SpainSri LankaSt. Kitts and NevisSt. LuciaSt. Vincent and the GrenadinesSub-Saharan Africa Sub-Saharan Africa (excluding high income)Sub-Saharan Africa (IDA & IBRD countries)SudanSurinameSwazilandSwedenSwitzerlandSyrian Arab RepublicTajikistanTanzaniaThailandTimor-LesteTogoTongaTrinidad and TobagoTunisiaTurkeyTurkmenistanTurks and Caicos IslandsTuvaluUgandaUkraineUnited Arab EmiratesUnited KingdomUnited StatesUpper middle incomeUruguayVanuatuVenezuela, RBVietnamVirgin Islands (U.S.)WorldYemen, Rep.ZambiaZimbabwe Linea del tempo:
Questa scala temporale mostra un grafico dal 1973 anno al 2011 anno. Caribbean small states. I dati fino ad 1972 anno non disponibili. Il numero di osservazioni attuali secondo i date: 39.
La fonte (nome):
Indicatori dello sviluppo mondiale
La fonte (organizzazione):
World Bank staff estimates from the Comtrade database maintained by the United Nations Statistics Division.
Categorie:
Agriculture & Rural Development, Private Sector, Trade
sono stati aggiornati
23 apr 2017 anni
Indicatori delle variazioni dei valori per anni
Minima:
0.885
1 gen 2009 anni
Massimo:
2.086
1 gen 1985 anni
Alla data di osservazione
Valore
Variazione assoluta
La variazione rispetto al valore precedente
1 gen 1973 anni
1.412
+1.412
0.0%
1 gen 1974 anni
1.611
+0.199
14.12%
1 gen 1975 anni
1.249
-0.362
-22.47%
1 gen 1976 anni
1.111
-0.139
-11.1%
1 gen 1977 anni
1.271
+0.16
14.43%
1 gen 1978 anni
1.804
+0.533
41.93%
1 gen 1979 anni
1.576
-0.227
-12.6%
1 gen 1980 anni
1.562
-0.014
-0.89%
1 gen 1981 anni
1.341
-0.221
-14.18%
1 gen 1982 anni
1.37
+0.03
2.21%
1 gen 1983 anni
1.668
+0.298
21.72%
1 gen 1984 anni
2.058
+0.39
23.4%
1 gen 1985 anni
2.086
+0.027
1.32%
1 gen 1986 anni
1.763
-0.323
-15.48%
1 gen 1987 anni
1.755
-0.008
-0.46%
1 gen 1988 anni
1.713
-0.042
-2.37%
1 gen 1989 anni
1.39
-0.323
-18.87%
1 gen 1990 anni
1.321
-0.068
-4.92%
1 gen 1991 anni
1.284
-0.037
-2.83%
1 gen 1992 anni
1.432
+0.148
11.56%
1 gen 1993 anni
1.287
-0.146
-10.16%
1 gen 1994 anni
1.535
+0.248
19.28%
1 gen 1995 anni
1.472
-0.062
-4.07%
1 gen 1996 anni
1.324
-0.149
-10.11%
1 gen 1997 anni
1.282
-0.041
-3.13%
1 gen 1998 anni
1.389
+0.107
8.34%
1 gen 1999 anni
1.377
-0.012
-0.84%
1 gen 2000 anni
1.662
+0.285
20.7%
1 gen 2001 anni
1.466
-0.196
-11.82%
1 gen 2002 anni
1.201
-0.265
-18.06%
1 gen 2003 anni
1.316
+0.115
9.55%
1 gen 2004 anni
1.137
-0.179
-13.57%
1 gen 2005 anni
1.235
+0.098
8.6%
1 gen 2006 anni
1.252
+0.017
1.35%
1 gen 2007 anni
1.252
0.0
-0.02%
1 gen 2008 anni
1.124
-0.128
-10.2%
1 gen 2009 anni
0.885
-0.239
-21.27%
1 gen 2010 anni
0.965
+0.08
9.07%
1 gen 2011 anni
1.002
+0.037
3.8%
Classificazione dei paesi secondo i statistiche attuali per anni


Commenti: