29
/it/
it
AIzaSyAYiBZKx7MnpbEhh9jyipgxe19OcubqV5w
April 1, 2024
60941
Sub-Saharan Africa (IDA & IBRD countries)
TSS
false
2
1
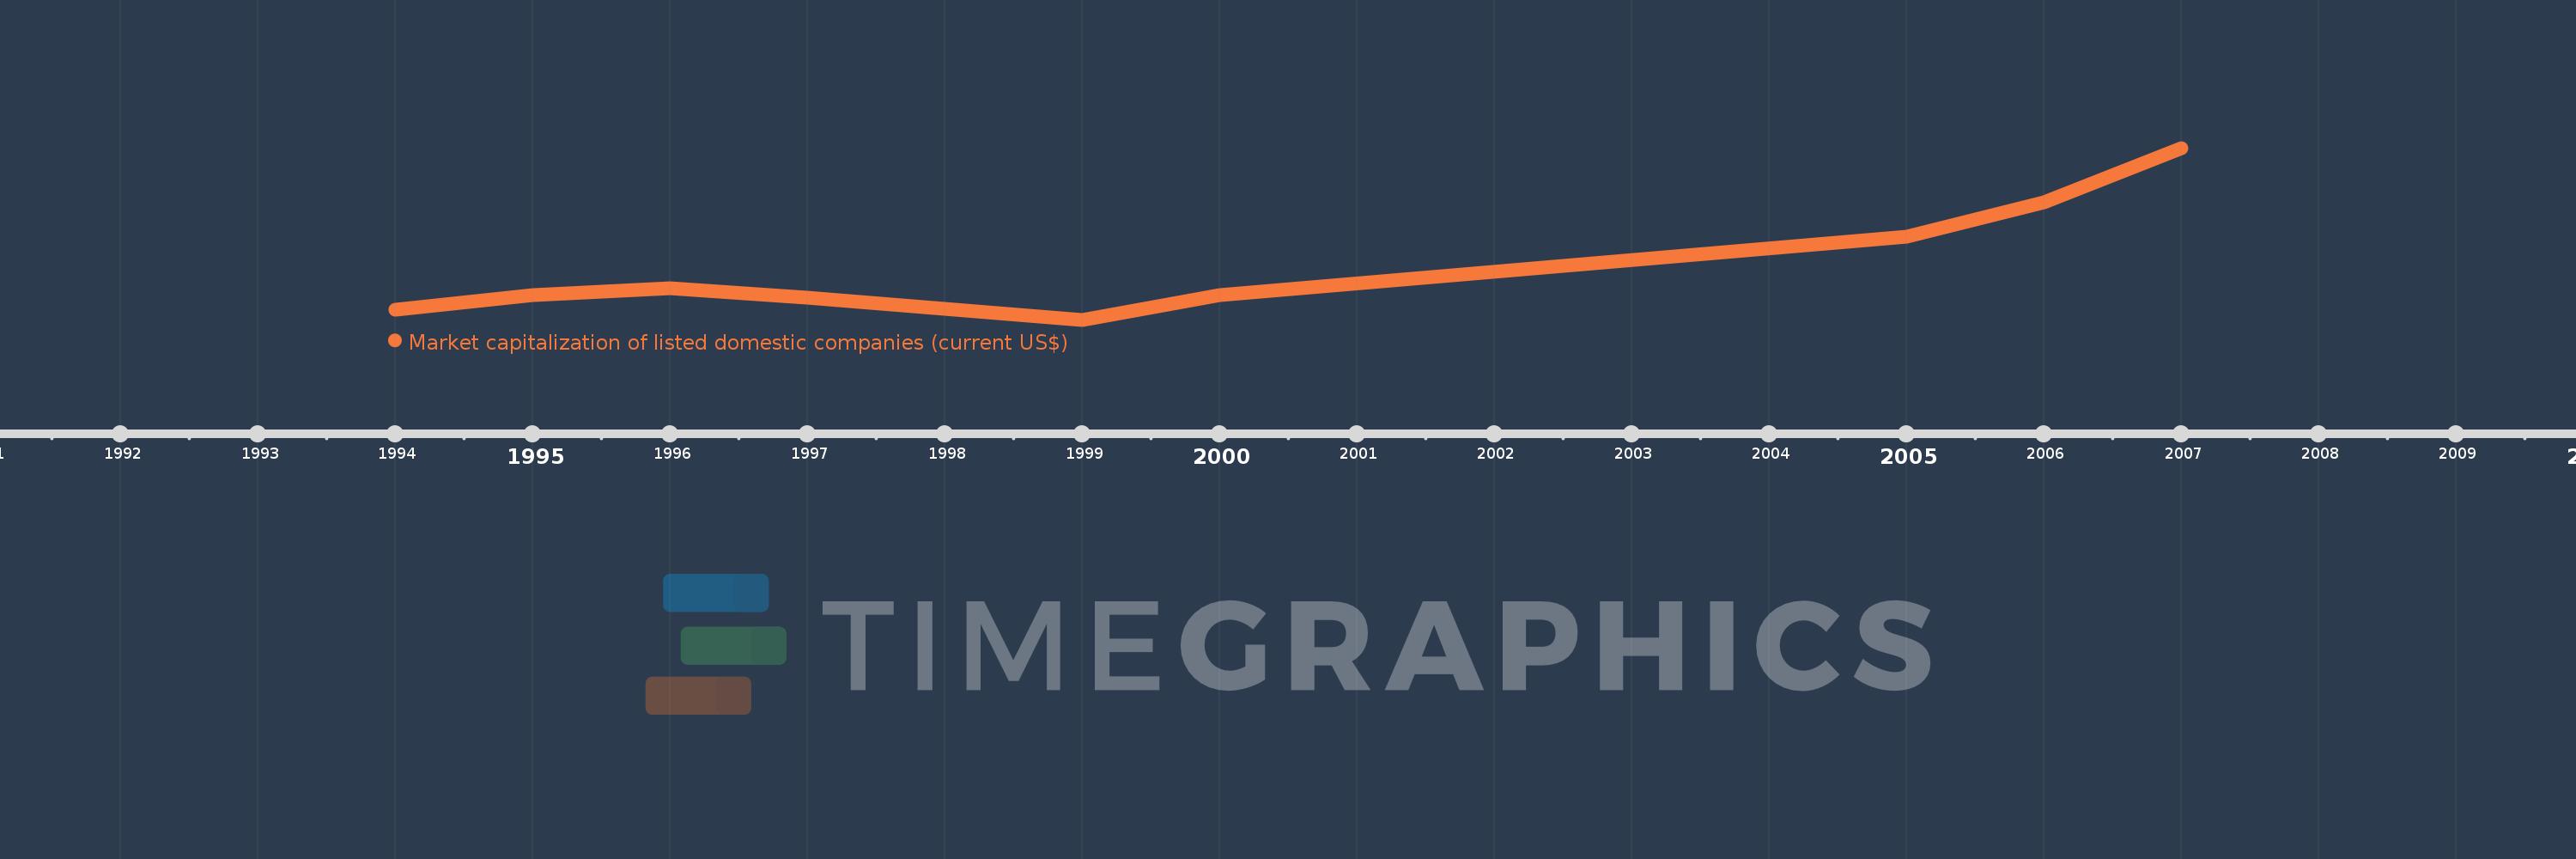
Market capitalization of listed domestic companies (current US$)
2007,2006,2005,2000,1999,1997,1996,1995,1994
Queste statistiche in altri paesi:
Linea del tempo:
Questa scala temporale mostra un grafico dal 1994 anno al 2007 anno. Sub-Saharan Africa (IDA & IBRD countries). I dati fino ad 1993 anno non disponibili. Il numero di osservazioni attuali secondo i date: 9.
La fonte (nome):
Indicatori dello sviluppo mondiale
La fonte (organizzazione):
World Federation of Exchanges database.
Categorie:
Financial Sector
sono stati aggiornati
23 apr 2017 anni
Indicatori delle variazioni dei valori per anni
Minima:
188.339 Mlrd
1 gen 1999 anni
Massimo:
769.326 Mlrd
1 gen 2007 anni
Alla data di osservazione
Valore
Variazione assoluta
La variazione rispetto al valore precedente
1 gen 1994 anni
223.152 Mlrd
+223.152 Mlrd
0.0%
1 gen 1995 anni
271.273 Mlrd
+48.121 Mlrd
21.56%
1 gen 1996 anni
293.736 Mlrd
+22.462 Mlrd
8.28%
1 gen 1997 anni
264.414 Mlrd
-29.322 Mlrd
-9.98%
1 gen 1999 anni
188.339 Mlrd
-76.075 Mlrd
-28.77%
1 gen 2000 anni
271.134 Mlrd
+82.795 Mlrd
43.96%
1 gen 2005 anni
469.178 Mlrd
+198.044 Mlrd
73.04%
1 gen 2006 anni
586.375 Mlrd
+117.197 Mlrd
24.98%
1 gen 2007 anni
769.326 Mlrd
+182.951 Mlrd
31.2%
Classificazione dei paesi secondo i statistiche attuali per anni


Commenti: