29
/it/
it
AIzaSyAYiBZKx7MnpbEhh9jyipgxe19OcubqV5w
April 1, 2024
54971
Post-demographic dividend
PST
false
2
1
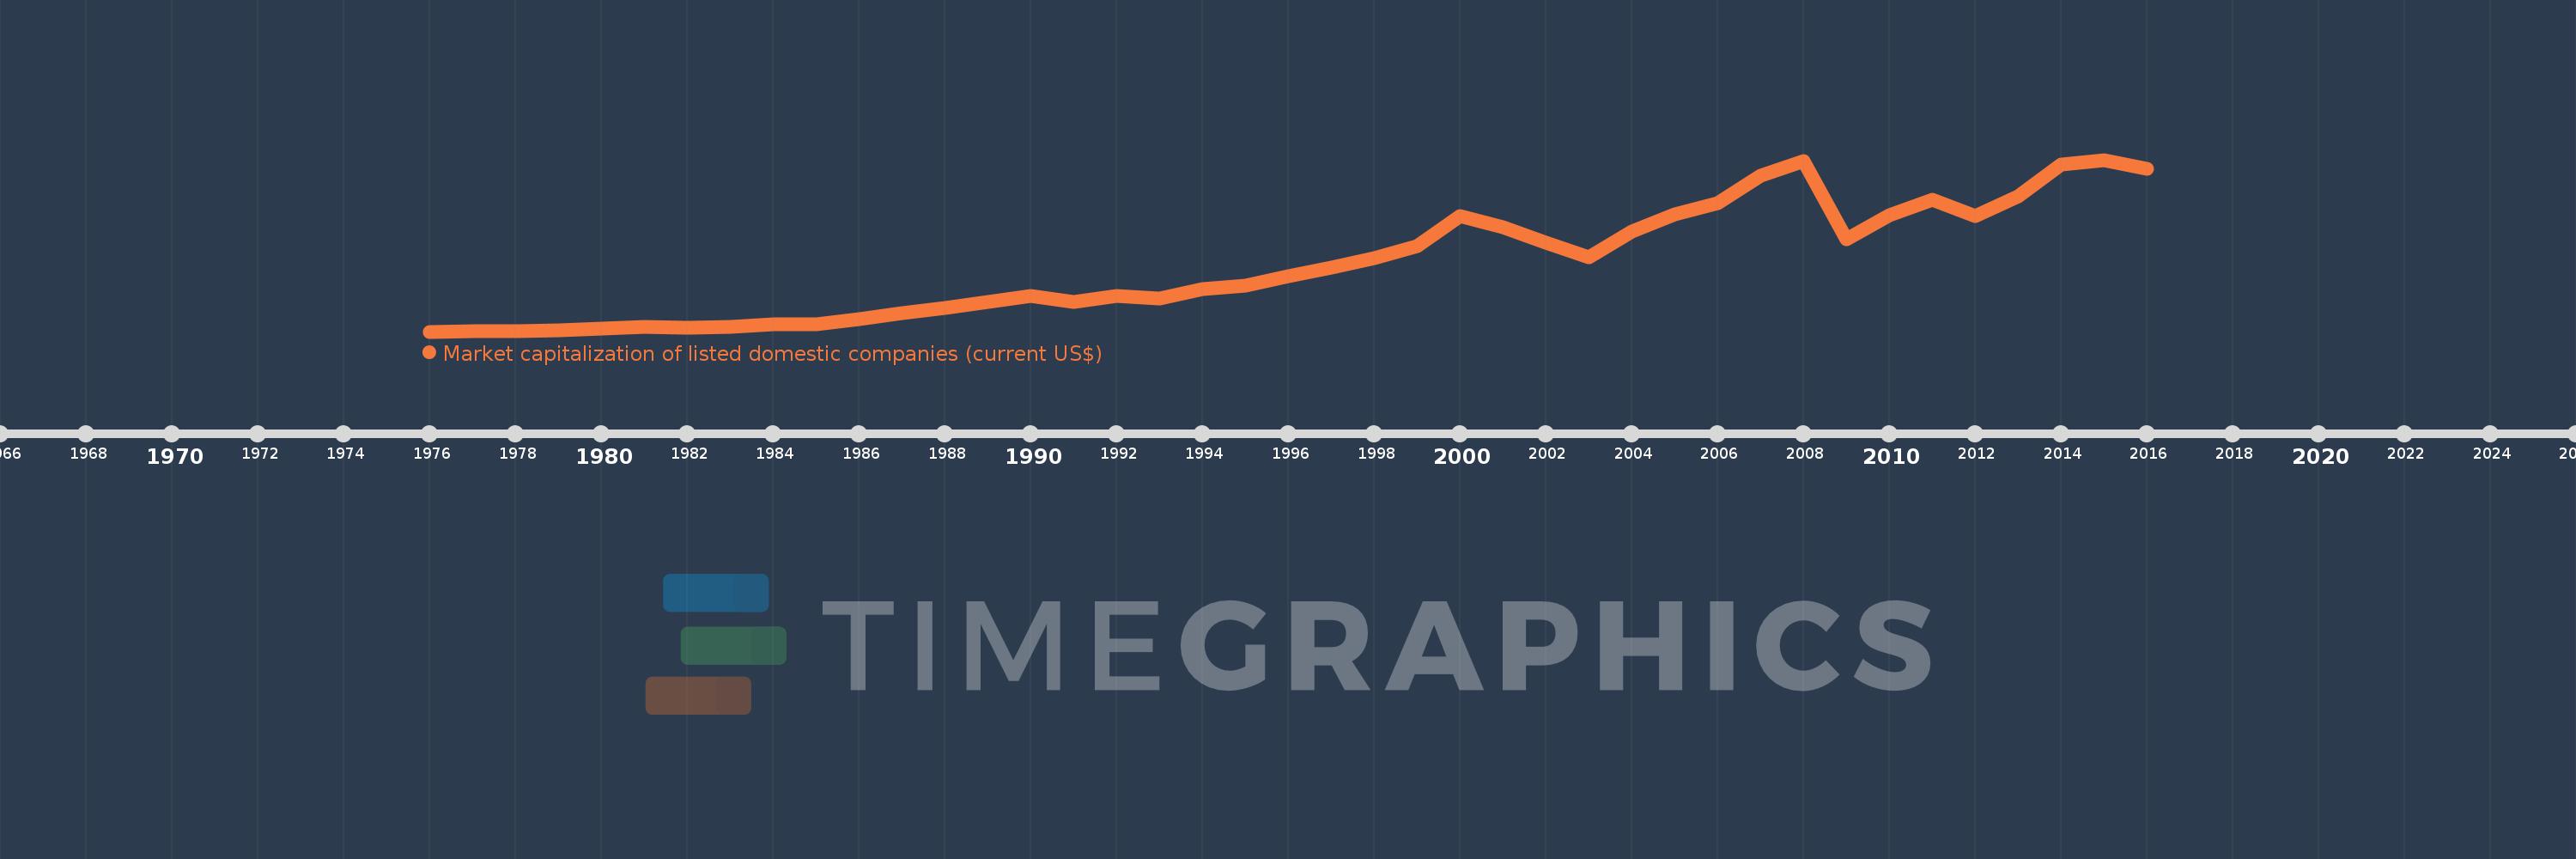
Market capitalization of listed domestic companies (current US$)
2016,2015,2014,2013,2012,2011,2010,2009,2008,2007,2006,2005,2004,2003,2002,2001,2000,1999,1998,1997,1996,1995,1994,1993,1992,1991,1990,1989,1988,1987,1986,1985,1984,1983,1982,1981,1980,1979,1978,1977,1976
Queste statistiche in altri paesi:
Linea del tempo:
Questa scala temporale mostra un grafico dal 1976 anno al 2016 anno. Post-demographic dividend. I dati fino ad 1975 anno non disponibili. Il numero di osservazioni attuali secondo i date: 41.
La fonte (nome):
Indicatori dello sviluppo mondiale
La fonte (organizzazione):
World Federation of Exchanges database.
Categorie:
Financial Sector
sono stati aggiornati
23 apr 2017 anni
Indicatori delle variazioni dei valori per anni
Minima:
1.192 Trln
1 gen 1976 anni
Massimo:
47.949 Trln
1 gen 2015 anni
Alla data di osservazione
Valore
Variazione assoluta
La variazione rispetto al valore precedente
1 gen 1976 anni
1.192 Trln
+1.192 Trln
0.0%
1 gen 1977 anni
1.382 Trln
+190.325 Mlrd
15.96%
1 gen 1978 anni
1.326 Trln
-56.362 Mlrd
-4.08%
1 gen 1979 anni
1.493 Trln
+166.582 Mlrd
12.56%
1 gen 1980 anni
1.908 Trln
+414.797 Mlrd
27.79%
1 gen 1981 anni
2.45 Trln
+542.365 Mlrd
28.43%
1 gen 1982 anni
2.34 Trln
-109.727 Mlrd
-4.48%
1 gen 1983 anni
2.583 Trln
+242.431 Mlrd
10.36%
1 gen 1984 anni
3.214 Trln
+631.374 Mlrd
24.45%
1 gen 1985 anni
3.19 Trln
-24.265 Mlrd
-0.75%
1 gen 1986 anni
4.552 Trln
+1.362 Trln
42.7%
1 gen 1987 anni
6.227 Trln
+1.675 Trln
36.81%
1 gen 1988 anni
7.526 Trln
+1.299 Trln
20.86%
1 gen 1989 anni
9.218 Trln
+1.692 Trln
22.48%
1 gen 1990 anni
10.996 Trln
+1.778 Trln
19.29%
1 gen 1991 anni
9.211 Trln
-1.785 Trln
-16.23%
1 gen 1992 anni
10.83 Trln
+1.619 Trln
17.57%
1 gen 1993 anni
10.254 Trln
-575.977 Mlrd
-5.32%
1 gen 1994 anni
12.823 Trln
+2.569 Trln
25.06%
1 gen 1995 anni
13.646 Trln
+822.65 Mlrd
6.42%
1 gen 1996 anni
16.287 Trln
+2.641 Trln
19.35%
1 gen 1997 anni
18.619 Trln
+2.332 Trln
14.32%
1 gen 1998 anni
21.073 Trln
+2.453 Trln
13.18%
1 gen 1999 anni
24.522 Trln
+3.449 Trln
16.37%
1 gen 2000 anni
32.638 Trln
+8.116 Trln
33.1%
1 gen 2001 anni
29.5 Trln
-3.137 Trln
-9.61%
1 gen 2002 anni
25.479 Trln
-4.022 Trln
-13.63%
1 gen 2003 anni
21.485 Trln
-3.994 Trln
-15.67%
1 gen 2004 anni
28.517 Trln
+7.033 Trln
32.73%
1 gen 2005 anni
33.219 Trln
+4.701 Trln
16.49%
1 gen 2006 anni
36.207 Trln
+2.989 Trln
9.0%
1 gen 2007 anni
43.551 Trln
+7.344 Trln
20.28%
1 gen 2008 anni
47.685 Trln
+4.133 Trln
9.49%
1 gen 2009 anni
26.432 Trln
-21.253 Trln
-44.57%
1 gen 2010 anni
32.933 Trln
+6.502 Trln
24.6%
1 gen 2011 anni
37.185 Trln
+4.251 Trln
12.91%
1 gen 2012 anni
32.605 Trln
-4.579 Trln
-12.32%
1 gen 2013 anni
37.939 Trln
+5.334 Trln
16.36%
1 gen 2014 anni
46.56 Trln
+8.621 Trln
22.72%
1 gen 2015 anni
47.949 Trln
+1.389 Trln
2.98%
1 gen 2016 anni
45.594 Trln
-2.355 Trln
-4.91%
Classificazione dei paesi secondo i statistiche attuali per anni


Commenti: