Download Queste statistiche in altri paesi:
Linea del tempo:
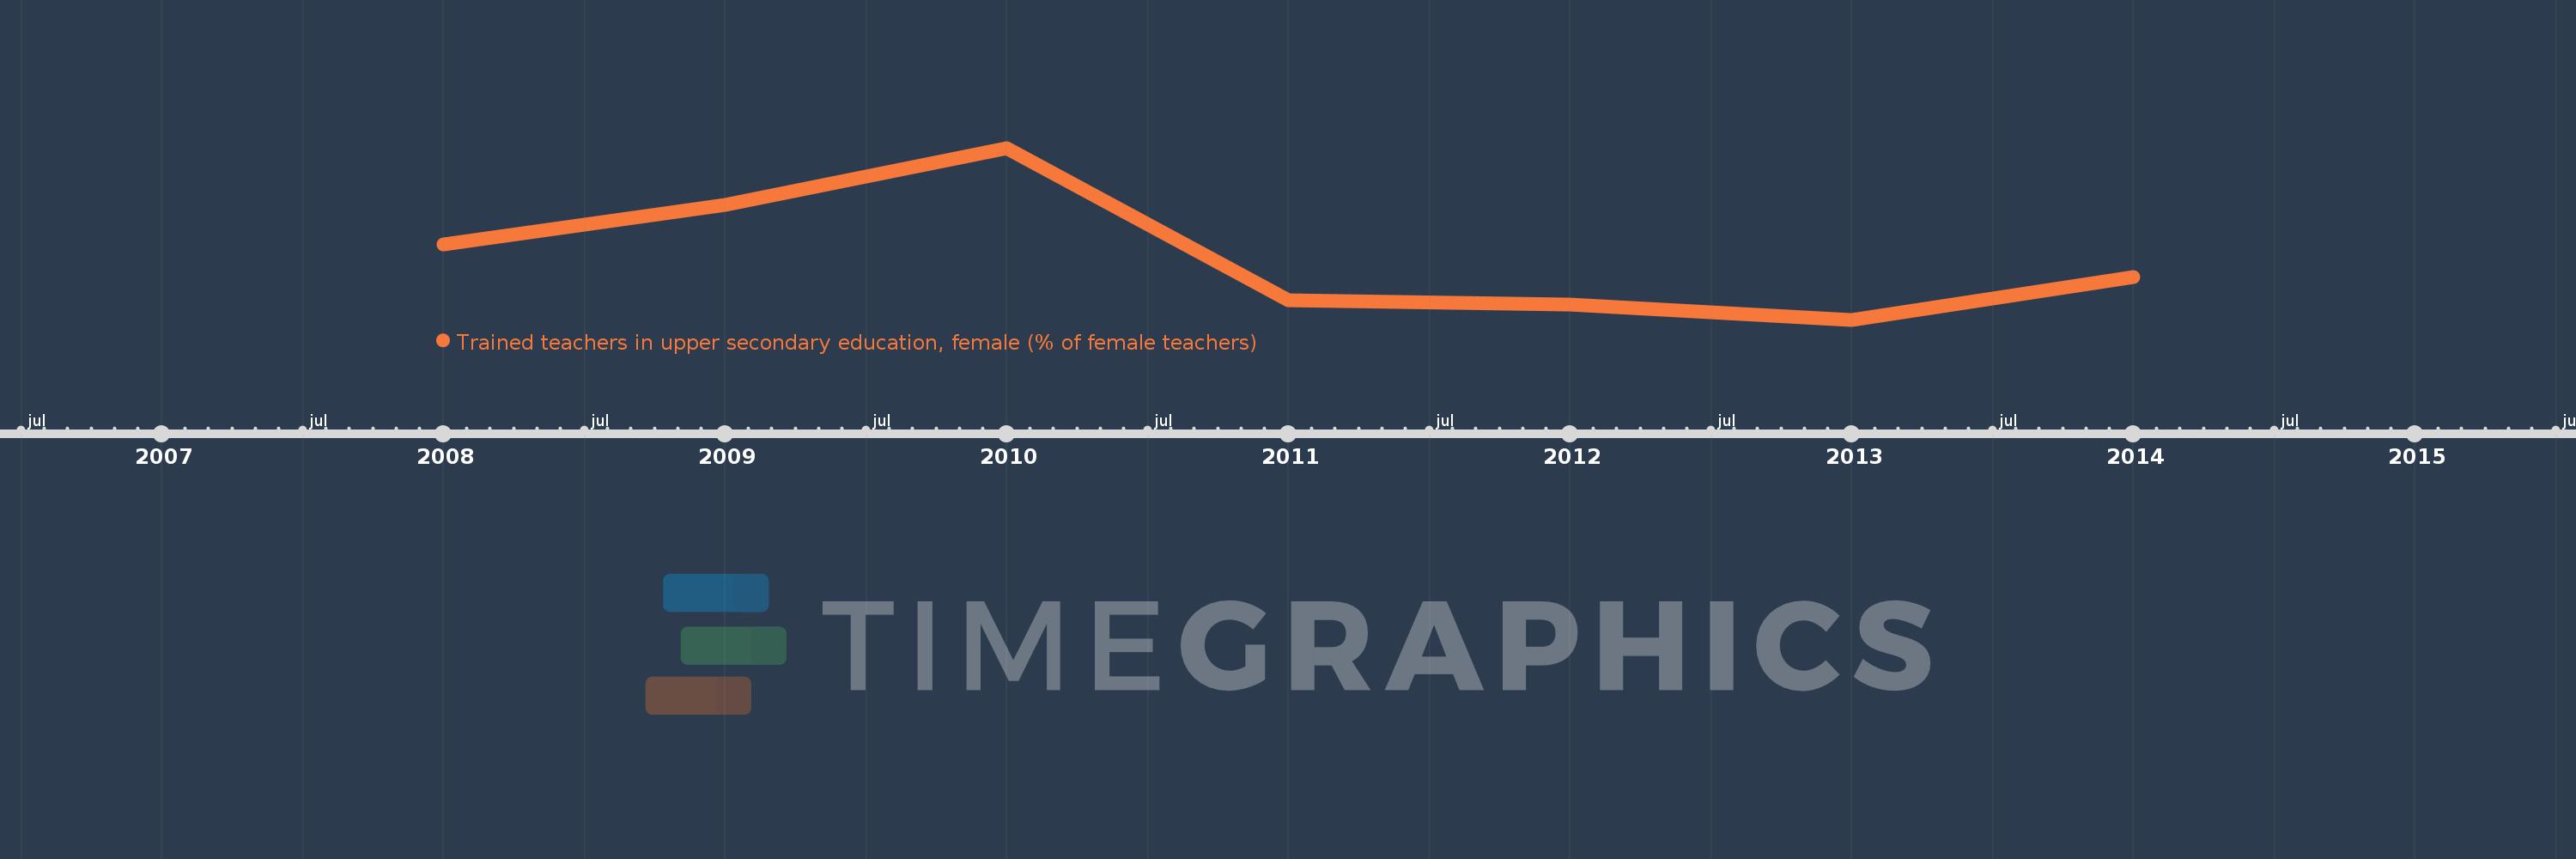
Questa scala temporale mostra un grafico dal 2008 anno al 2014 anno. Sub-Saharan Africa . I dati fino ad 2007 anno non disponibili. Il numero di osservazioni attuali secondo i date: 7.
La fonte (nome):
Indicatori dello sviluppo mondiale
La fonte (organizzazione):
United Nations Educational, Scientific, and Cultural Organization (UNESCO) Institute for Statistics.
Categorie:
Education
sono stati aggiornati
23 apr 2017 anni
Indicatori delle variazioni dei valori per anni
Minima:
53.84
1 gen 2013 anni
Massimo:
78.687
1 gen 2010 anni
Alla data di osservazione
Valore
Variazione assoluta
La variazione rispetto al valore precedente
1 gen 2008 anni
64.752
+64.752
0.0%
1 gen 2009 anni
70.431
+5.679
8.77%
1 gen 2010 anni
78.687
+8.256
11.72%
1 gen 2011 anni
56.652
-22.035
-28.0%
1 gen 2012 anni
56.082
-0.57
-1.01%
1 gen 2013 anni
53.84
-2.242
-4.0%
1 gen 2014 anni
60.019
+6.179
11.48%
Classificazione dei paesi secondo i statistiche attuali per anni
