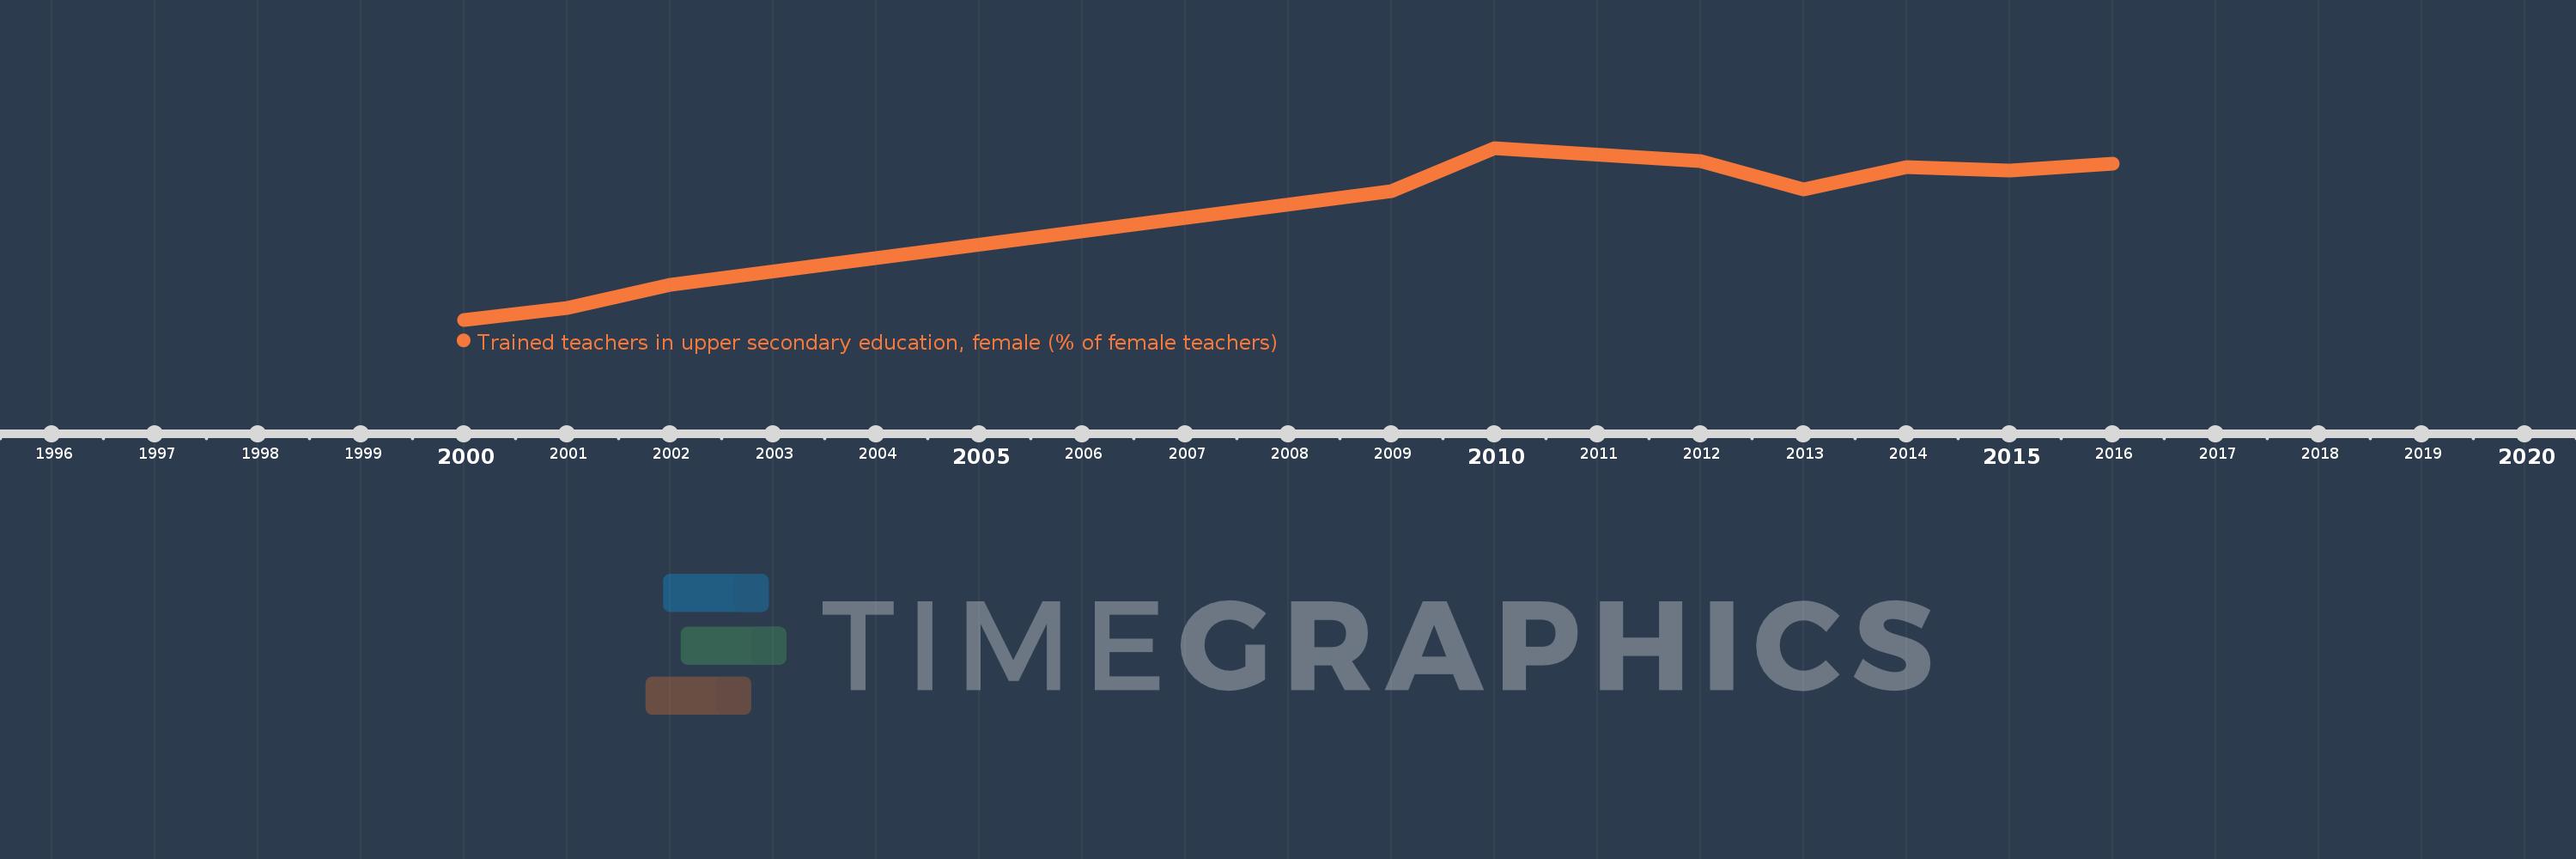
Questa scala temporale mostra un grafico dal 2000 anno al 2016 anno. Ghana. I dati fino ad 1999 anno non disponibili. Il numero di osservazioni attuali secondo i date: 10.
La fonte (nome):
Indicatori dello sviluppo mondiale
La fonte (organizzazione):
United Nations Educational, Scientific, and Cultural Organization (UNESCO) Institute for Statistics.
Categorie:
Education
sono stati aggiornati
23 apr 2017 anni
Indicatori delle variazioni dei valori per anni
In media:
75.77
Minima:
50.822
1 gen 2000 anni
Massimo:
89.979
1 gen 2010 anni
Alla data di osservazione
Valore
Variazione assoluta
La variazione rispetto al valore precedente
1 gen 2000 anni
50.822
+50.822
0.0%
1 gen 2001 anni
53.602
+2.779
5.47%
1 gen 2002 anni
58.861
+5.26
9.81%
1 gen 2009 anni
80.193
+21.332
36.24%
1 gen 2010 anni
89.979
+9.786
12.2%
1 gen 2012 anni
87.061
-2.919
-3.24%
1 gen 2013 anni
80.467
-6.594
-7.57%
1 gen 2014 anni
85.528
+5.061
6.29%
1 gen 2015 anni
84.761
-0.767
-0.9%
1 gen 2016 anni
86.427
+1.666
1.97%
Classificazione dei paesi secondo i statistiche attuali per anni
