29
/it/
it
AIzaSyAYiBZKx7MnpbEhh9jyipgxe19OcubqV5w
April 1, 2024
58650
South Asia (IDA & IBRD)
TSA
false
2
1
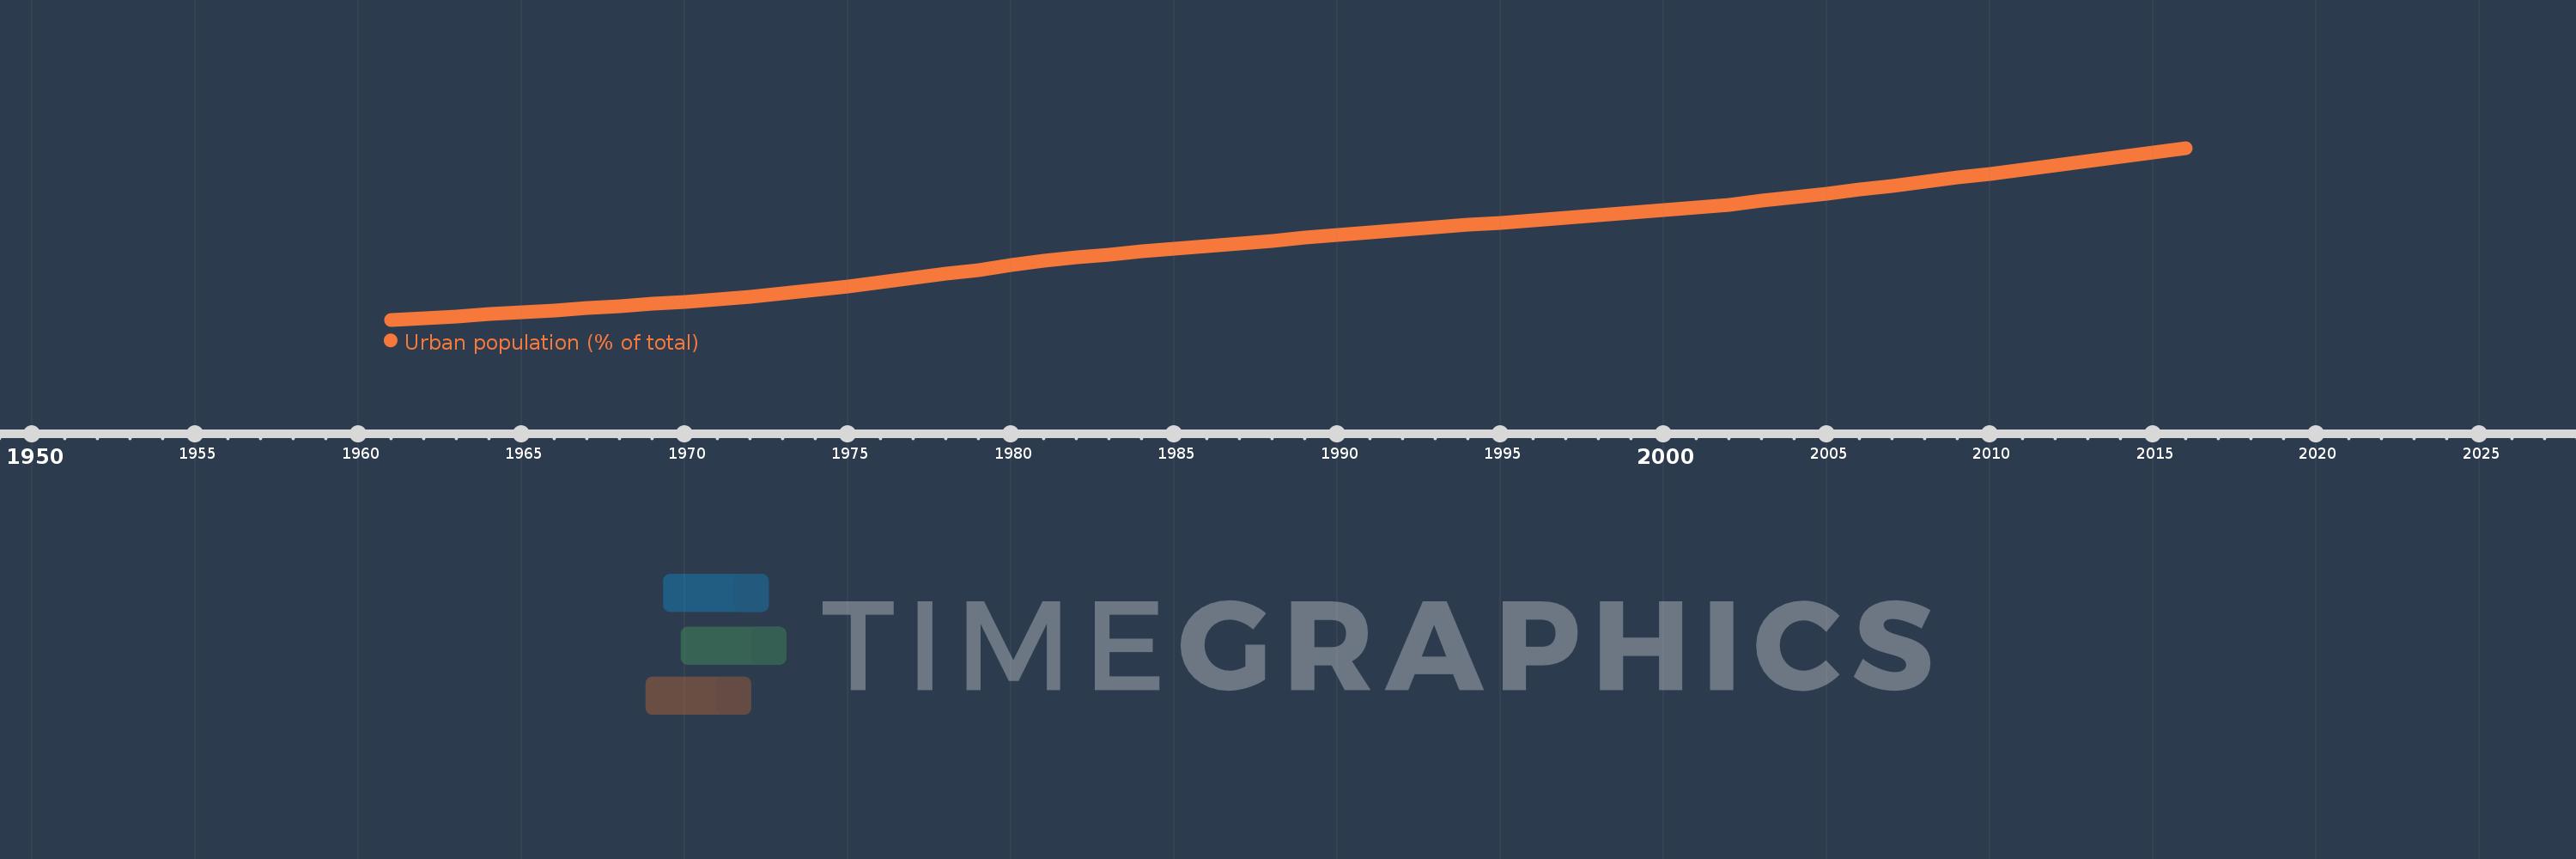
Urban population (% of total)
2016,2015,2014,2013,2012,2011,2010,2009,2008,2007,2006,2005,2004,2003,2002,2001,2000,1999,1998,1997,1996,1995,1994,1993,1992,1991,1990,1989,1988,1987,1986,1985,1984,1983,1982,1981,1980,1979,1978,1977,1976,1975,1974,1973,1972,1971,1970,1969,1968,1967,1966,1965,1964,1963,1962,1961
Queste statistiche in altri paesi:
AfghanistanAlbaniaAlgeriaAmerican SamoaAndorraAngolaAntigua and BarbudaArab WorldArgentinaArmeniaArubaAustraliaAustriaAzerbaijanBahamas, TheBahrainBangladeshBarbadosBelarusBelgiumBelizeBeninBermudaBhutanBoliviaBosnia and HerzegovinaBotswanaBrazilBritish Virgin IslandsBrunei DarussalamBulgariaBurkina FasoBurundiCabo VerdeCambodiaCameroonCanadaCaribbean small statesCayman IslandsCentral African RepublicCentral Europe and the BalticsChadChannel IslandsChileChinaColombiaComorosCongo, Dem. Rep.Congo, Rep.Costa RicaCote d'IvoireCroatiaCubaCuracaoCyprusCzech RepublicDenmarkDjiboutiDominicaDominican RepublicEarly-demographic dividendEast Asia & PacificEast Asia & Pacific (excluding high income)East Asia & Pacific (IDA & IBRD countries)EcuadorEgypt, Arab Rep.El SalvadorEquatorial GuineaEritreaEstoniaEthiopiaEuro areaEurope & Central AsiaEurope & Central Asia (excluding high income)Europe & Central Asia (IDA & IBRD countries)European UnionFaroe IslandsFijiFinlandFragile and conflict affected situationsFranceFrench PolynesiaGabonGambia, TheGeorgiaGermanyGhanaGibraltarGreeceGreenlandGrenadaGuamGuatemalaGuineaGuinea-BissauGuyanaHaitiHeavily indebted poor countries (HIPC)High incomeHondurasHong Kong SAR, ChinaHungaryIBRD onlyIcelandIDA & IBRD totalIDA blendIDA onlyIDA totalIndiaIndonesiaIran, Islamic Rep.IraqIrelandIsle of ManIsraelItalyJamaicaJapanJordanKazakhstanKenyaKiribatiKorea, Dem. People’s Rep.Korea, Rep.KuwaitKyrgyz RepublicLao PDRLate-demographic dividendLatin America & Caribbean Latin America & Caribbean (excluding high income)Latin America & the Caribbean (IDA & IBRD countries)LatviaLeast developed countries: UN classificationLebanonLesothoLiberiaLibyaLiechtensteinLithuaniaLow & middle incomeLow incomeLower middle incomeLuxembourgMacao SAR, ChinaMacedonia, FYRMadagascarMalawiMalaysiaMaldivesMaliMaltaMarshall IslandsMauritaniaMauritiusMexicoMicronesia, Fed. Sts.Middle East & North AfricaMiddle East & North Africa (excluding high income)Middle East & North Africa (IDA & IBRD countries)Middle incomeMoldovaMonacoMongoliaMontenegroMoroccoMozambiqueMyanmarNamibiaNauruNepalNetherlandsNew CaledoniaNew ZealandNicaraguaNigerNigeriaNorth AmericaNorthern Mariana IslandsNorwayOECD membersOmanOther small statesPacific island small statesPakistanPalauPanamaPapua New GuineaParaguayPeruPhilippinesPolandPortugalPost-demographic dividendPre-demographic dividendPuerto RicoQatarRomaniaRussian FederationRwandaSamoaSan MarinoSao Tome and PrincipeSaudi ArabiaSenegalSerbiaSeychellesSierra LeoneSingaporeSint Maarten (Dutch part)Slovak RepublicSloveniaSmall statesSolomon IslandsSomaliaSouth AfricaSouth AsiaSouth Asia (IDA & IBRD)South SudanSpainSri LankaSt. Kitts and NevisSt. LuciaSt. Vincent and the GrenadinesSub-Saharan Africa Sub-Saharan Africa (excluding high income)Sub-Saharan Africa (IDA & IBRD countries)SudanSurinameSwazilandSwedenSwitzerlandSyrian Arab RepublicTajikistanTanzaniaThailandTimor-LesteTogoTongaTrinidad and TobagoTunisiaTurkeyTurkmenistanTurks and Caicos IslandsTuvaluUgandaUkraineUnited Arab EmiratesUnited KingdomUnited StatesUpper middle incomeUruguayUzbekistanVanuatuVenezuela, RBVietnamVirgin Islands (U.S.)West Bank and GazaWorldYemen, Rep.ZambiaZimbabwe Linea del tempo:
Questa scala temporale mostra un grafico dal 1961 anno al 2016 anno. South Asia (IDA & IBRD). I dati fino ad 1960 anno non disponibili. Il numero di osservazioni attuali secondo i date: 56.
La fonte (nome):
Indicatori dello sviluppo mondiale
La fonte (organizzazione):
United Nations, World Urbanization Prospects.
Categorie:
Climate Change, Urban Development
sono stati aggiornati
23 apr 2017 anni
Indicatori delle variazioni dei valori per anni
Minima:
16.736
1 gen 1961 anni
Massimo:
33.028
1 gen 2016 anni
Alla data di osservazione
Valore
Variazione assoluta
La variazione rispetto al valore precedente
1 gen 1961 anni
16.736
+16.736
0.0%
1 gen 1962 anni
16.867
+0.131
0.79%
1 gen 1963 anni
17.054
+0.187
1.11%
1 gen 1964 anni
17.244
+0.189
1.11%
1 gen 1965 anni
17.439
+0.195
1.13%
1 gen 1966 anni
17.634
+0.196
1.12%
1 gen 1967 anni
17.832
+0.197
1.12%
1 gen 1968 anni
18.031
+0.199
1.12%
1 gen 1969 anni
18.233
+0.203
1.12%
1 gen 1970 anni
18.441
+0.208
1.14%
1 gen 1971 anni
18.657
+0.215
1.17%
1 gen 1972 anni
18.904
+0.247
1.33%
1 gen 1973 anni
19.23
+0.325
1.72%
1 gen 1974 anni
19.561
+0.332
1.72%
1 gen 1975 anni
19.912
+0.351
1.79%
1 gen 1976 anni
20.292
+0.38
1.91%
1 gen 1977 anni
20.678
+0.386
1.9%
1 gen 1978 anni
21.072
+0.394
1.91%
1 gen 1979 anni
21.476
+0.404
1.92%
1 gen 1980 anni
21.891
+0.415
1.93%
1 gen 1981 anni
22.316
+0.425
1.94%
1 gen 1982 anni
22.691
+0.375
1.68%
1 gen 1983 anni
22.943
+0.252
1.11%
1 gen 1984 anni
23.198
+0.255
1.11%
1 gen 1985 anni
23.455
+0.258
1.11%
1 gen 1986 anni
23.714
+0.258
1.1%
1 gen 1987 anni
23.974
+0.26
1.1%
1 gen 1988 anni
24.235
+0.261
1.09%
1 gen 1989 anni
24.498
+0.263
1.09%
1 gen 1990 anni
24.762
+0.264
1.08%
1 gen 1991 anni
25.025
+0.264
1.06%
1 gen 1992 anni
25.276
+0.25
1.0%
1 gen 1993 anni
25.498
+0.223
0.88%
1 gen 1994 anni
25.722
+0.224
0.88%
1 gen 1995 anni
25.948
+0.226
0.88%
1 gen 1996 anni
26.177
+0.228
0.88%
1 gen 1997 anni
26.41
+0.233
0.89%
1 gen 1998 anni
26.645
+0.236
0.89%
1 gen 1999 anni
26.884
+0.238
0.89%
1 gen 2000 anni
27.125
+0.241
0.9%
1 gen 2001 anni
27.369
+0.244
0.9%
1 gen 2002 anni
27.652
+0.283
1.03%
1 gen 2003 anni
28.003
+0.352
1.27%
1 gen 2004 anni
28.359
+0.356
1.27%
1 gen 2005 anni
28.721
+0.361
1.27%
1 gen 2006 anni
29.086
+0.365
1.27%
1 gen 2007 anni
29.457
+0.371
1.27%
1 gen 2008 anni
29.833
+0.376
1.28%
1 gen 2009 anni
30.214
+0.381
1.28%
1 gen 2010 anni
30.598
+0.384
1.27%
1 gen 2011 anni
30.986
+0.388
1.27%
1 gen 2012 anni
31.379
+0.392
1.27%
1 gen 2013 anni
31.779
+0.401
1.28%
1 gen 2014 anni
32.187
+0.408
1.28%
1 gen 2015 anni
32.603
+0.416
1.29%
1 gen 2016 anni
33.028
+0.425
1.3%
Classificazione dei paesi secondo i statistiche attuali per anni


Commenti: