29
/it/
it
AIzaSyAYiBZKx7MnpbEhh9jyipgxe19OcubqV5w
April 1, 2024
220359
Papua New Guinea
PNG
true
2
1
Urban population (% of total)
2016,2015,2014,2013,2012,2011,2010,2009,2008,2007,2006,2005,2004,2003,2002,2001,2000,1999,1998,1997,1996,1995,1994,1993,1992,1991,1990,1989,1988,1987,1986,1985,1984,1983,1982,1981,1980,1979,1978,1977,1976,1975,1974,1973,1972,1971,1970,1969,1968,1967,1966,1965,1964,1963,1962,1961
Queste statistiche in altri paesi:
AfghanistanAlbaniaAlgeriaAmerican SamoaAndorraAngolaAntigua and BarbudaArab WorldArgentinaArmeniaArubaAustraliaAustriaAzerbaijanBahamas, TheBahrainBangladeshBarbadosBelarusBelgiumBelizeBeninBermudaBhutanBoliviaBosnia and HerzegovinaBotswanaBrazilBritish Virgin IslandsBrunei DarussalamBulgariaBurkina FasoBurundiCabo VerdeCambodiaCameroonCanadaCaribbean small statesCayman IslandsCentral African RepublicCentral Europe and the BalticsChadChannel IslandsChileChinaColombiaComorosCongo, Dem. Rep.Congo, Rep.Costa RicaCote d'IvoireCroatiaCubaCuracaoCyprusCzech RepublicDenmarkDjiboutiDominicaDominican RepublicEarly-demographic dividendEast Asia & PacificEast Asia & Pacific (excluding high income)East Asia & Pacific (IDA & IBRD countries)EcuadorEgypt, Arab Rep.El SalvadorEquatorial GuineaEritreaEstoniaEthiopiaEuro areaEurope & Central AsiaEurope & Central Asia (excluding high income)Europe & Central Asia (IDA & IBRD countries)European UnionFaroe IslandsFijiFinlandFragile and conflict affected situationsFranceFrench PolynesiaGabonGambia, TheGeorgiaGermanyGhanaGibraltarGreeceGreenlandGrenadaGuamGuatemalaGuineaGuinea-BissauGuyanaHaitiHeavily indebted poor countries (HIPC)High incomeHondurasHong Kong SAR, ChinaHungaryIBRD onlyIcelandIDA & IBRD totalIDA blendIDA onlyIDA totalIndiaIndonesiaIran, Islamic Rep.IraqIrelandIsle of ManIsraelItalyJamaicaJapanJordanKazakhstanKenyaKiribatiKorea, Dem. People’s Rep.Korea, Rep.KuwaitKyrgyz RepublicLao PDRLate-demographic dividendLatin America & Caribbean Latin America & Caribbean (excluding high income)Latin America & the Caribbean (IDA & IBRD countries)LatviaLeast developed countries: UN classificationLebanonLesothoLiberiaLibyaLiechtensteinLithuaniaLow & middle incomeLow incomeLower middle incomeLuxembourgMacao SAR, ChinaMacedonia, FYRMadagascarMalawiMalaysiaMaldivesMaliMaltaMarshall IslandsMauritaniaMauritiusMexicoMicronesia, Fed. Sts.Middle East & North AfricaMiddle East & North Africa (excluding high income)Middle East & North Africa (IDA & IBRD countries)Middle incomeMoldovaMonacoMongoliaMontenegroMoroccoMozambiqueMyanmarNamibiaNauruNepalNetherlandsNew CaledoniaNew ZealandNicaraguaNigerNigeriaNorth AmericaNorthern Mariana IslandsNorwayOECD membersOmanOther small statesPacific island small statesPakistanPalauPanamaPapua New GuineaParaguayPeruPhilippinesPolandPortugalPost-demographic dividendPre-demographic dividendPuerto RicoQatarRomaniaRussian FederationRwandaSamoaSan MarinoSao Tome and PrincipeSaudi ArabiaSenegalSerbiaSeychellesSierra LeoneSingaporeSint Maarten (Dutch part)Slovak RepublicSloveniaSmall statesSolomon IslandsSomaliaSouth AfricaSouth AsiaSouth Asia (IDA & IBRD)South SudanSpainSri LankaSt. Kitts and NevisSt. LuciaSt. Vincent and the GrenadinesSub-Saharan Africa Sub-Saharan Africa (excluding high income)Sub-Saharan Africa (IDA & IBRD countries)SudanSurinameSwazilandSwedenSwitzerlandSyrian Arab RepublicTajikistanTanzaniaThailandTimor-LesteTogoTongaTrinidad and TobagoTunisiaTurkeyTurkmenistanTurks and Caicos IslandsTuvaluUgandaUkraineUnited Arab EmiratesUnited KingdomUnited StatesUpper middle incomeUruguayUzbekistanVanuatuVenezuela, RBVietnamVirgin Islands (U.S.)West Bank and GazaWorldYemen, Rep.ZambiaZimbabwe Linea del tempo:
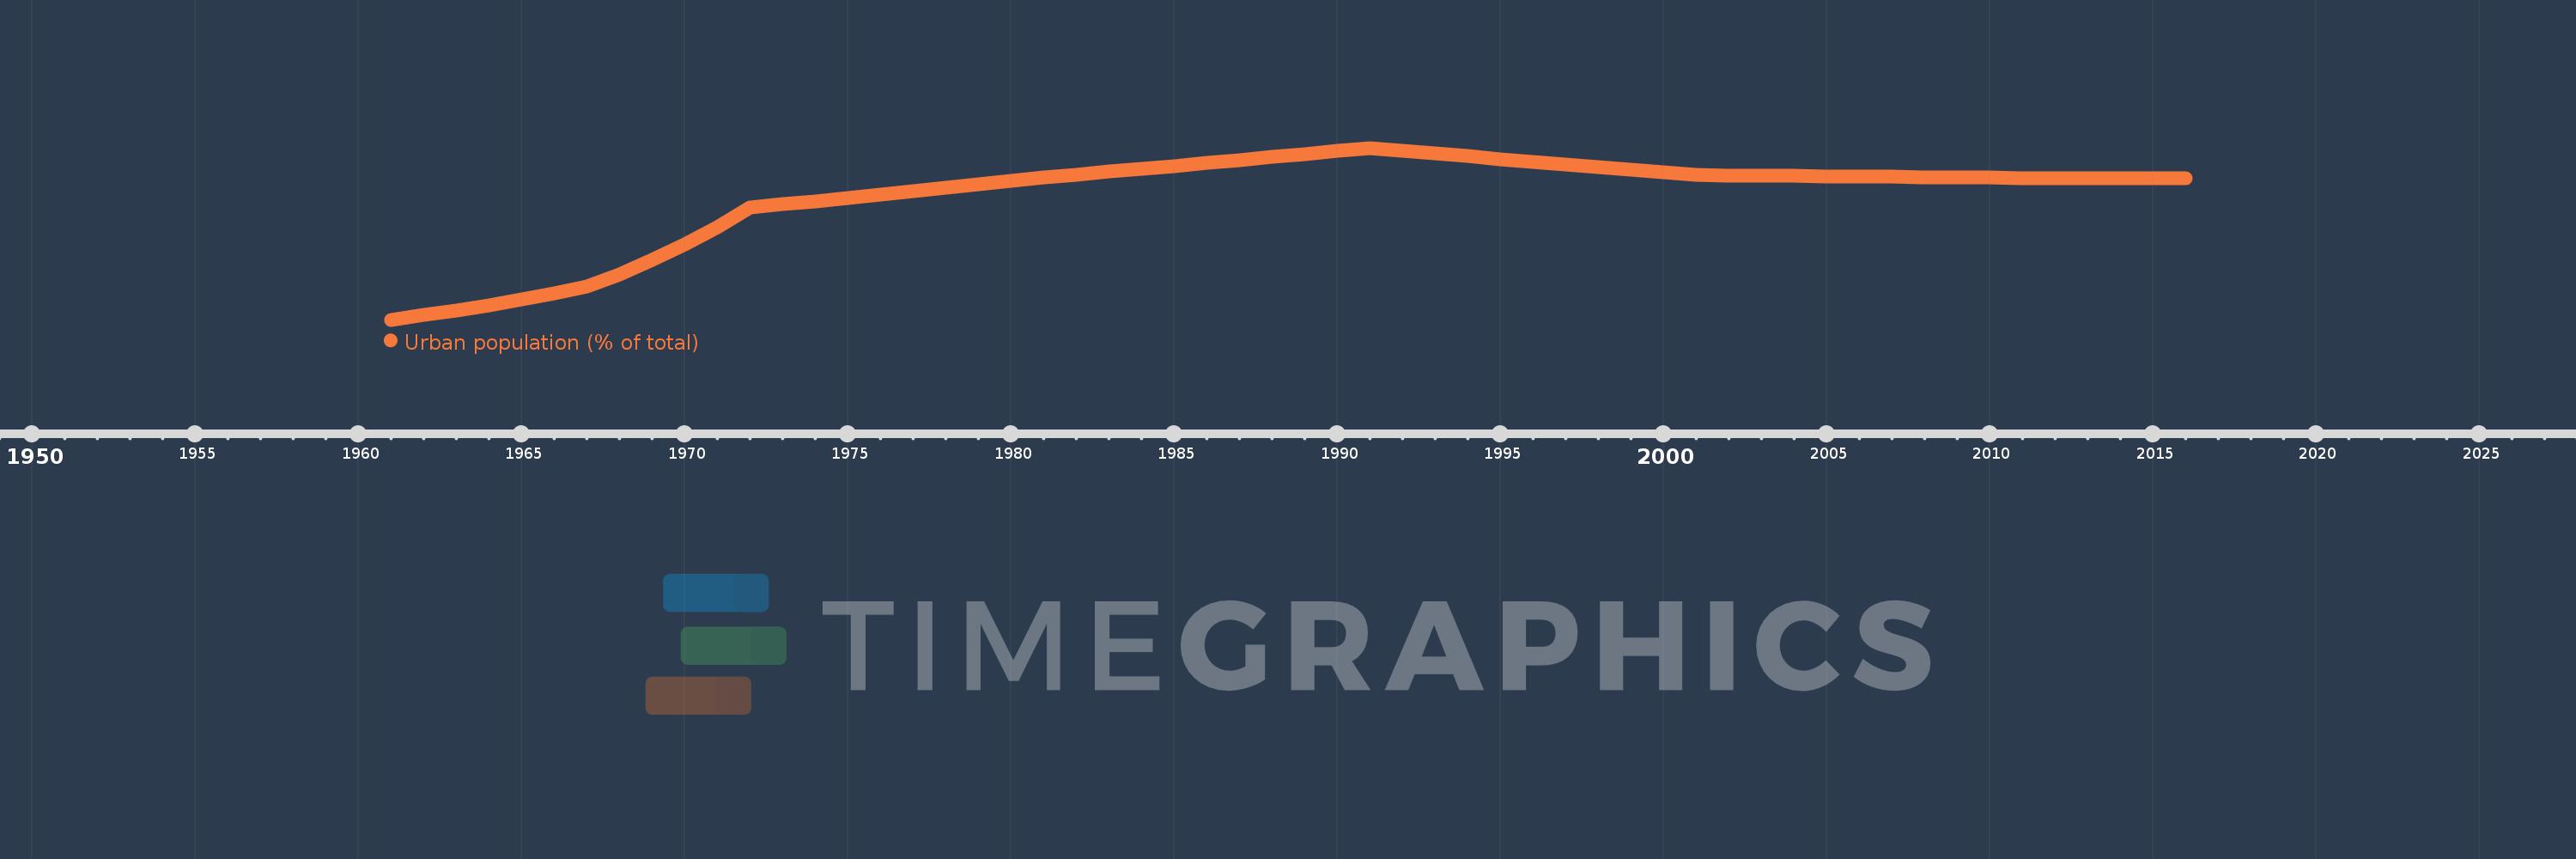
Questa scala temporale mostra un grafico dal 1961 anno al 2016 anno. Papua New Guinea. I dati fino ad 1960 anno non disponibili. Il numero di osservazioni attuali secondo i date: 56.
La fonte (nome):
Indicatori dello sviluppo mondiale
La fonte (organizzazione):
United Nations, World Urbanization Prospects.
Categorie:
Climate Change, Urban Development
sono stati aggiornati
23 apr 2017 anni
Indicatori delle variazioni dei valori per anni
Minima:
3.725
1 gen 1961 anni
Massimo:
14.994
1 gen 1991 anni
Alla data di osservazione
Valore
Variazione assoluta
La variazione rispetto al valore precedente
1 gen 1961 anni
3.725
+3.725
0.0%
1 gen 1962 anni
4.024
+0.299
8.03%
1 gen 1963 anni
4.347
+0.323
8.03%
1 gen 1964 anni
4.694
+0.347
7.98%
1 gen 1965 anni
5.069
+0.375
7.99%
1 gen 1966 anni
5.47
+0.401
7.91%
1 gen 1967 anni
5.902
+0.432
7.9%
1 gen 1968 anni
6.712
+0.81
13.72%
1 gen 1969 anni
7.625
+0.913
13.6%
1 gen 1970 anni
8.649
+1.024
13.43%
1 gen 1971 anni
9.796
+1.147
13.26%
1 gen 1972 anni
11.078
+1.282
13.09%
1 gen 1973 anni
11.3
+0.222
2.0%
1 gen 1974 anni
11.507
+0.207
1.83%
1 gen 1975 anni
11.717
+0.21
1.82%
1 gen 1976 anni
11.93
+0.213
1.82%
1 gen 1977 anni
12.147
+0.217
1.82%
1 gen 1978 anni
12.366
+0.219
1.8%
1 gen 1979 anni
12.59
+0.224
1.81%
1 gen 1980 anni
12.817
+0.227
1.8%
1 gen 1981 anni
13.047
+0.23
1.79%
1 gen 1982 anni
13.242
+0.195
1.49%
1 gen 1983 anni
13.428
+0.186
1.4%
1 gen 1984 anni
13.616
+0.188
1.4%
1 gen 1985 anni
13.806
+0.19
1.4%
1 gen 1986 anni
13.998
+0.192
1.39%
1 gen 1987 anni
14.193
+0.195
1.39%
1 gen 1988 anni
14.39
+0.197
1.39%
1 gen 1989 anni
14.589
+0.199
1.38%
1 gen 1990 anni
14.791
+0.202
1.38%
1 gen 1991 anni
14.994
+0.203
1.37%
1 gen 1992 anni
14.816
-0.178
-1.19%
1 gen 1993 anni
14.629
-0.187
-1.26%
1 gen 1994 anni
14.445
-0.184
-1.26%
1 gen 1995 anni
14.262
-0.183
-1.27%
1 gen 1996 anni
14.081
-0.181
-1.27%
1 gen 1997 anni
13.901
-0.18
-1.28%
1 gen 1998 anni
13.724
-0.177
-1.27%
1 gen 1999 anni
13.549
-0.175
-1.28%
1 gen 2000 anni
13.375
-0.174
-1.28%
1 gen 2001 anni
13.204
-0.171
-1.28%
1 gen 2002 anni
13.182
-0.022
-0.17%
1 gen 2003 anni
13.164
-0.018
-0.14%
1 gen 2004 anni
13.146
-0.018
-0.14%
1 gen 2005 anni
13.127
-0.019
-0.14%
1 gen 2006 anni
13.109
-0.018
-0.14%
1 gen 2007 anni
13.091
-0.018
-0.14%
1 gen 2008 anni
13.073
-0.018
-0.14%
1 gen 2009 anni
13.055
-0.018
-0.14%
1 gen 2010 anni
13.037
-0.018
-0.14%
1 gen 2011 anni
13.019
-0.018
-0.14%
1 gen 2012 anni
13.0
-0.019
-0.15%
1 gen 2013 anni
12.982
-0.018
-0.14%
1 gen 2014 anni
12.977
-0.005
-0.04%
1 gen 2015 anni
12.985
+0.008
0.06%
1 gen 2016 anni
13.005
+0.02
0.15%
Classificazione dei paesi secondo i statistiche attuali per anni


Commenti: