29
/it/
it
AIzaSyAYiBZKx7MnpbEhh9jyipgxe19OcubqV5w
April 1, 2024
56990
South Asia
SAS
false
2
1
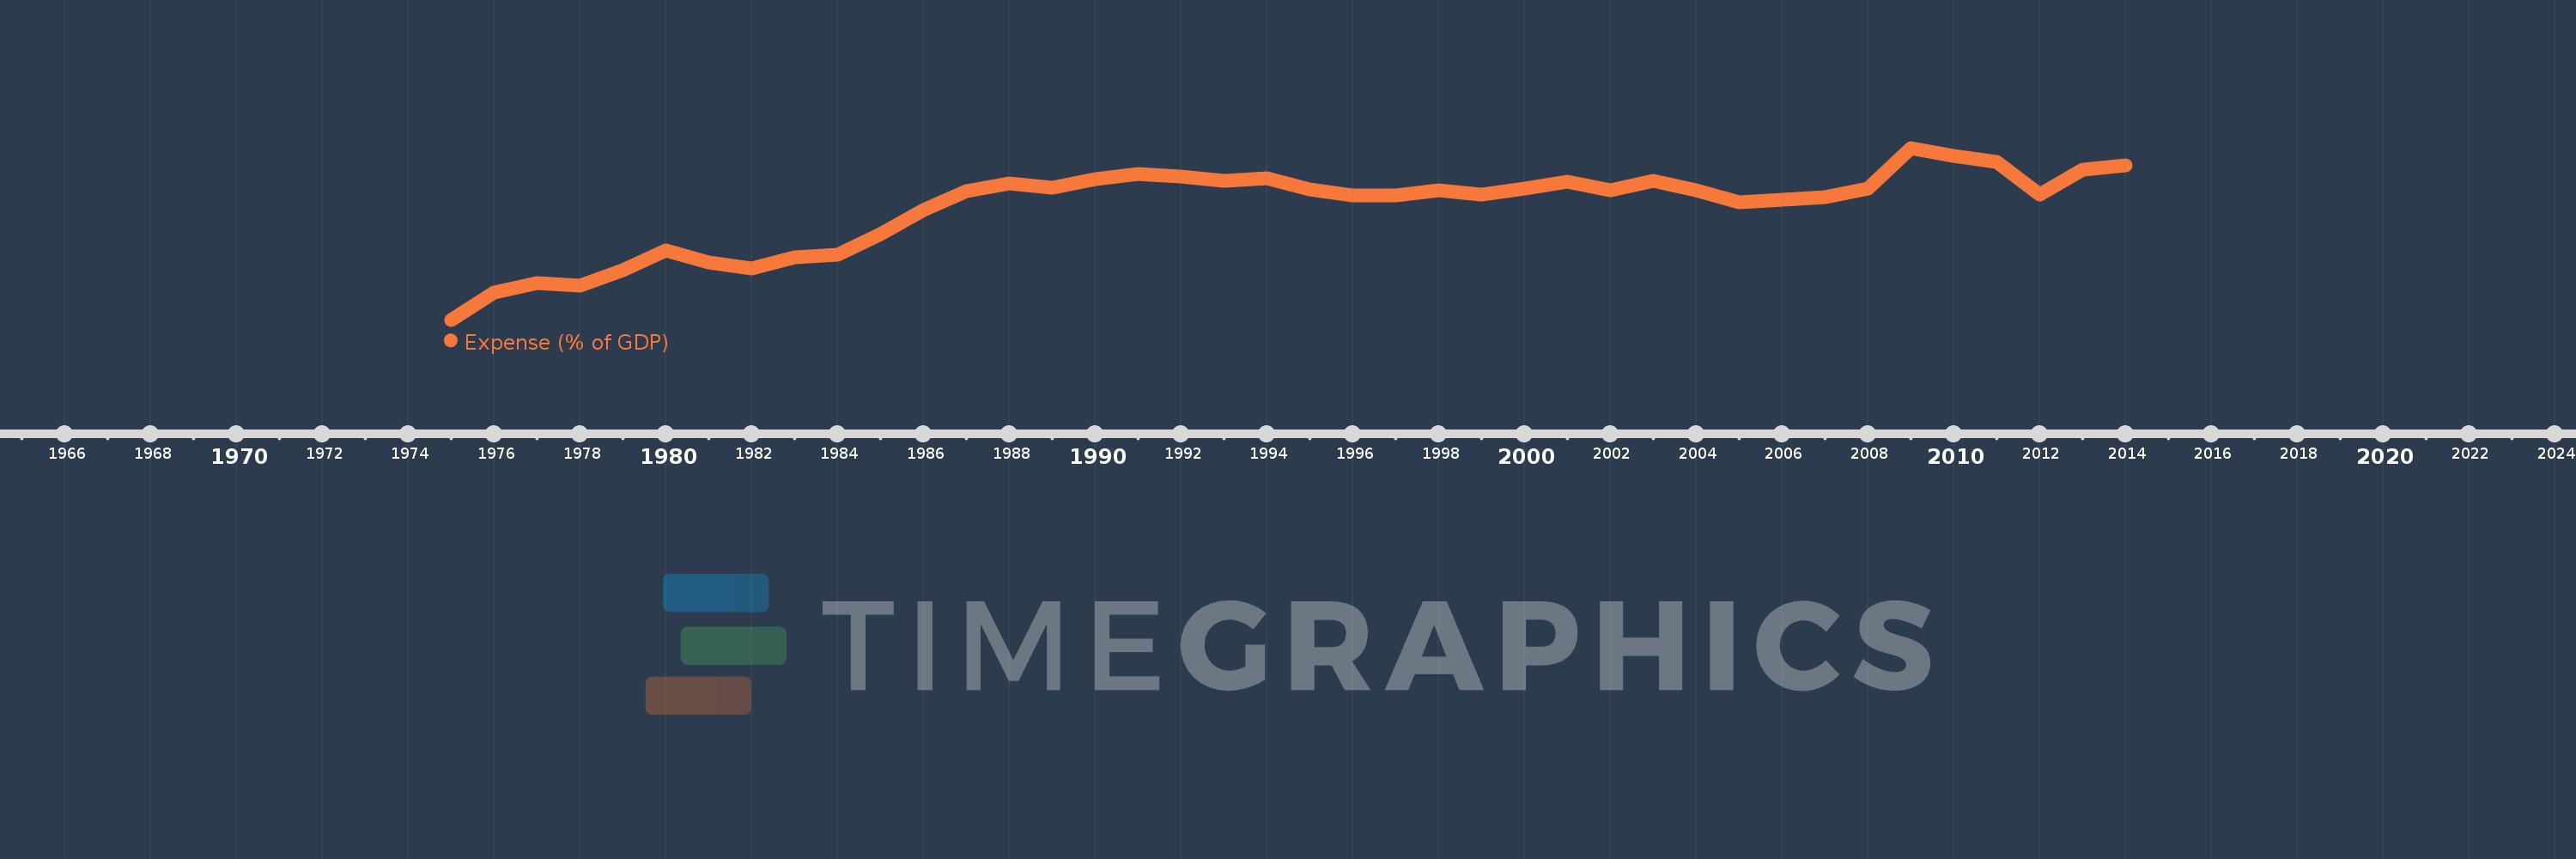
Expense (% of GDP)
2014,2013,2012,2011,2010,2009,2008,2007,2006,2005,2004,2003,2002,2001,2000,1999,1998,1997,1996,1995,1994,1993,1992,1991,1990,1989,1988,1987,1986,1985,1984,1983,1982,1981,1980,1979,1978,1977,1976,1975
Queste statistiche in altri paesi:
AfghanistanAlbaniaAlgeriaAngolaAntigua and BarbudaArmeniaAustraliaAustriaAzerbaijanBahamas, TheBahrainBangladeshBarbadosBelarusBelgiumBelizeBeninBhutanBoliviaBosnia and HerzegovinaBotswanaBrazilBulgariaBurkina FasoBurundiCabo VerdeCambodiaCanadaCaribbean small statesCentral African RepublicCentral Europe and the BalticsChileColombiaCongo, Dem. Rep.Congo, Rep.Costa RicaCote d'IvoireCroatiaCyprusCzech RepublicDenmarkDominicaDominican RepublicEarly-demographic dividendEgypt, Arab Rep.El SalvadorEquatorial GuineaEstoniaEthiopiaEuro areaEurope & Central AsiaEurope & Central Asia (excluding high income)Europe & Central Asia (IDA & IBRD countries)European UnionFijiFinlandFranceGambia, TheGeorgiaGermanyGhanaGreeceGrenadaGuatemalaHeavily indebted poor countries (HIPC)High incomeHondurasHong Kong SAR, ChinaHungaryIcelandIDA blendIDA onlyIDA totalIndiaIndonesiaIran, Islamic Rep.IraqIrelandIsraelItalyJamaicaJapanJordanKazakhstanKenyaKiribatiKorea, Rep.KuwaitKyrgyz RepublicLao PDRLatin America & Caribbean Latin America & Caribbean (excluding high income)Latin America & the Caribbean (IDA & IBRD countries)LatviaLeast developed countries: UN classificationLebanonLesothoLiberiaLithuaniaLow incomeLower middle incomeLuxembourgMacao SAR, ChinaMacedonia, FYRMadagascarMalawiMalaysiaMaldivesMaliMaltaMauritiusMexicoMicronesia, Fed. Sts.Middle East & North Africa (excluding high income)Middle East & North Africa (IDA & IBRD countries)MoldovaMongoliaMoroccoMozambiqueMyanmarNamibiaNepalNetherlandsNew ZealandNicaraguaNigeriaNorth AmericaNorwayOECD membersOmanOther small statesPacific island small statesPakistanPanamaPapua New GuineaParaguayPeruPhilippinesPolandPortugalPost-demographic dividendPre-demographic dividendQatarRomaniaRussian FederationRwandaSamoaSan MarinoSao Tome and PrincipeSenegalSerbiaSeychellesSierra LeoneSingaporeSlovak RepublicSloveniaSmall statesSolomon IslandsSouth AfricaSouth AsiaSouth Asia (IDA & IBRD)SpainSri LankaSt. Kitts and NevisSt. LuciaSub-Saharan Africa Sub-Saharan Africa (excluding high income)Sub-Saharan Africa (IDA & IBRD countries)SurinameSwazilandSwedenSwitzerlandSyrian Arab RepublicTajikistanTanzaniaThailandTimor-LesteTogoTrinidad and TobagoTunisiaTurkeyUgandaUkraineUnited Arab EmiratesUnited KingdomUnited StatesUruguayVanuatuVenezuela, RBVietnamWest Bank and GazaWorldYemen, Rep.ZambiaZimbabwe Linea del tempo:
Questa scala temporale mostra un grafico dal 1975 anno al 2014 anno. South Asia. I dati fino ad 1974 anno non disponibili. Il numero di osservazioni attuali secondo i date: 40.
La fonte (nome):
Indicatori dello sviluppo mondiale
La fonte (organizzazione):
International Monetary Fund, Government Finance Statistics Yearbook and data files, and World Bank and OECD GDP estimates.
Categorie:
Economy & Growth, Public Sector
sono stati aggiornati
23 apr 2017 anni
Indicatori delle variazioni dei valori per anni
Minima:
8.582
1 gen 1975 anni
Massimo:
17.27
1 gen 2009 anni
Alla data di osservazione
Valore
Variazione assoluta
La variazione rispetto al valore precedente
1 gen 1975 anni
8.582
+8.582
0.0%
1 gen 1976 anni
9.938
+1.356
15.8%
1 gen 1977 anni
10.446
+0.508
5.11%
1 gen 1978 anni
10.324
-0.122
-1.17%
1 gen 1979 anni
11.076
+0.751
7.28%
1 gen 1980 anni
12.102
+1.027
9.27%
1 gen 1981 anni
11.501
-0.601
-4.97%
1 gen 1982 anni
11.18
-0.321
-2.79%
1 gen 1983 anni
11.757
+0.577
5.16%
1 gen 1984 anni
11.871
+0.114
0.97%
1 gen 1985 anni
12.919
+1.048
8.83%
1 gen 1986 anni
14.137
+1.218
9.43%
1 gen 1987 anni
15.076
+0.939
6.64%
1 gen 1988 anni
15.495
+0.42
2.78%
1 gen 1989 anni
15.257
-0.238
-1.54%
1 gen 1990 anni
15.701
+0.443
2.9%
1 gen 1991 anni
15.955
+0.255
1.62%
1 gen 1992 anni
15.806
-0.149
-0.94%
1 gen 1993 anni
15.6
-0.206
-1.3%
1 gen 1994 anni
15.744
+0.144
0.92%
1 gen 1995 anni
15.184
-0.56
-3.56%
1 gen 1996 anni
14.863
-0.321
-2.11%
1 gen 1997 anni
14.863
-0.001
0.0%
1 gen 1998 anni
15.143
+0.28
1.88%
1 gen 1999 anni
14.897
-0.246
-1.63%
1 gen 2000 anni
15.199
+0.302
2.03%
1 gen 2001 anni
15.583
+0.384
2.53%
1 gen 2002 anni
15.137
-0.446
-2.86%
1 gen 2003 anni
15.585
+0.448
2.96%
1 gen 2004 anni
15.13
-0.455
-2.92%
1 gen 2005 anni
14.535
-0.595
-3.93%
1 gen 2006 anni
14.633
+0.098
0.68%
1 gen 2007 anni
14.761
+0.128
0.87%
1 gen 2008 anni
15.223
+0.462
3.13%
1 gen 2009 anni
17.27
+2.047
13.45%
1 gen 2010 anni
16.873
-0.397
-2.3%
1 gen 2011 anni
16.582
-0.291
-1.73%
1 gen 2012 anni
14.904
-1.678
-10.12%
1 gen 2013 anni
16.164
+1.26
8.45%
1 gen 2014 anni
16.39
+0.226
1.4%
Classificazione dei paesi secondo i statistiche attuali per anni


Commenti: