29
/it/
it
AIzaSyAYiBZKx7MnpbEhh9jyipgxe19OcubqV5w
April 1, 2024
116828
Cyprus
CYP
true
2
1
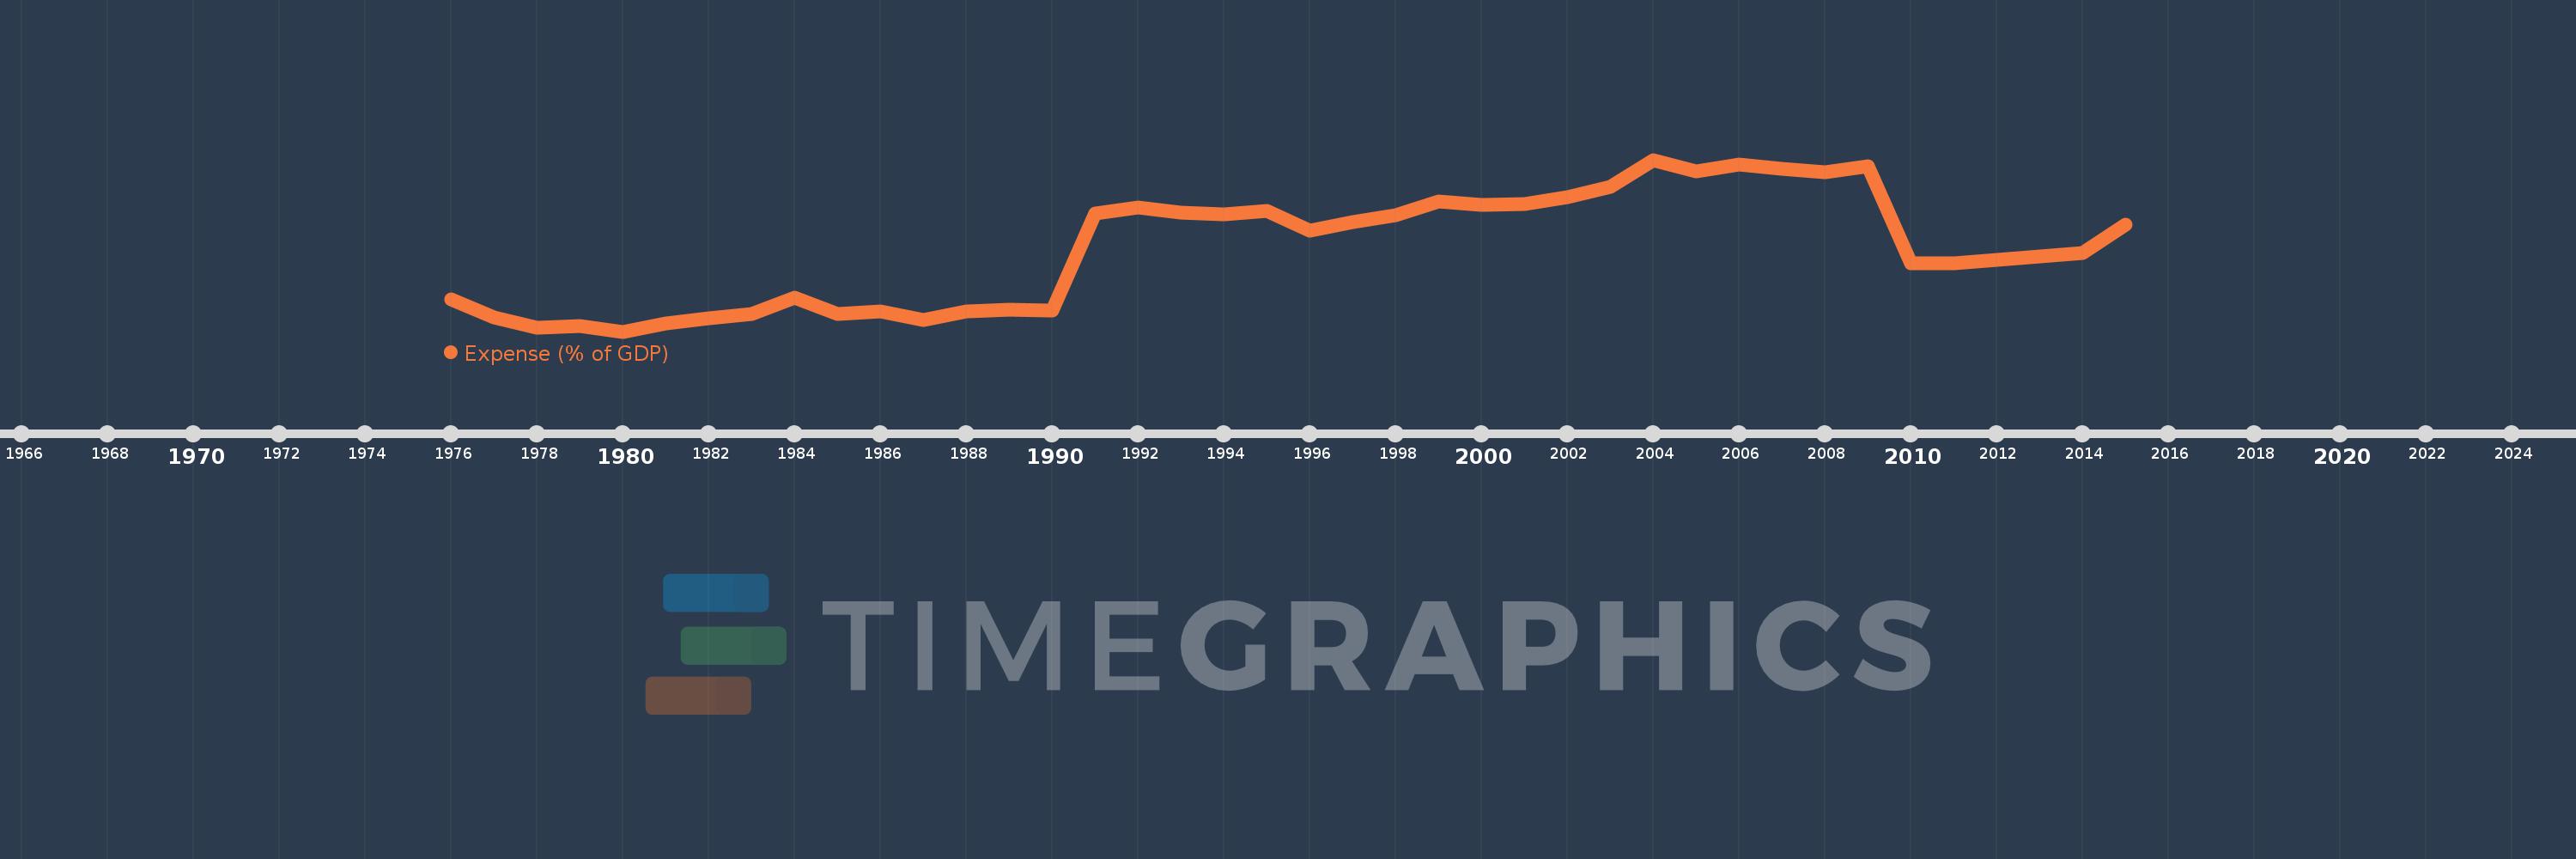
Expense (% of GDP)
2015,2014,2013,2012,2011,2010,2009,2008,2007,2006,2005,2004,2003,2002,2001,2000,1999,1998,1997,1996,1995,1994,1993,1992,1991,1990,1989,1988,1987,1986,1985,1984,1983,1982,1981,1980,1979,1978,1977,1976
Queste statistiche in altri paesi:
AfghanistanAlbaniaAlgeriaAngolaAntigua and BarbudaArmeniaAustraliaAustriaAzerbaijanBahamas, TheBahrainBangladeshBarbadosBelarusBelgiumBelizeBeninBhutanBoliviaBosnia and HerzegovinaBotswanaBrazilBulgariaBurkina FasoBurundiCabo VerdeCambodiaCanadaCaribbean small statesCentral African RepublicCentral Europe and the BalticsChileColombiaCongo, Dem. Rep.Congo, Rep.Costa RicaCote d'IvoireCroatiaCyprusCzech RepublicDenmarkDominicaDominican RepublicEarly-demographic dividendEgypt, Arab Rep.El SalvadorEquatorial GuineaEstoniaEthiopiaEuro areaEurope & Central AsiaEurope & Central Asia (excluding high income)Europe & Central Asia (IDA & IBRD countries)European UnionFijiFinlandFranceGambia, TheGeorgiaGermanyGhanaGreeceGrenadaGuatemalaHeavily indebted poor countries (HIPC)High incomeHondurasHong Kong SAR, ChinaHungaryIcelandIDA blendIDA onlyIDA totalIndiaIndonesiaIran, Islamic Rep.IraqIrelandIsraelItalyJamaicaJapanJordanKazakhstanKenyaKiribatiKorea, Rep.KuwaitKyrgyz RepublicLao PDRLatin America & Caribbean Latin America & Caribbean (excluding high income)Latin America & the Caribbean (IDA & IBRD countries)LatviaLeast developed countries: UN classificationLebanonLesothoLiberiaLithuaniaLow incomeLower middle incomeLuxembourgMacao SAR, ChinaMacedonia, FYRMadagascarMalawiMalaysiaMaldivesMaliMaltaMauritiusMexicoMicronesia, Fed. Sts.Middle East & North Africa (excluding high income)Middle East & North Africa (IDA & IBRD countries)MoldovaMongoliaMoroccoMozambiqueMyanmarNamibiaNepalNetherlandsNew ZealandNicaraguaNigeriaNorth AmericaNorwayOECD membersOmanOther small statesPacific island small statesPakistanPanamaPapua New GuineaParaguayPeruPhilippinesPolandPortugalPost-demographic dividendPre-demographic dividendQatarRomaniaRussian FederationRwandaSamoaSan MarinoSao Tome and PrincipeSenegalSerbiaSeychellesSierra LeoneSingaporeSlovak RepublicSloveniaSmall statesSolomon IslandsSouth AfricaSouth AsiaSouth Asia (IDA & IBRD)SpainSri LankaSt. Kitts and NevisSt. LuciaSub-Saharan Africa Sub-Saharan Africa (excluding high income)Sub-Saharan Africa (IDA & IBRD countries)SurinameSwazilandSwedenSwitzerlandSyrian Arab RepublicTajikistanTanzaniaThailandTimor-LesteTogoTrinidad and TobagoTunisiaTurkeyUgandaUkraineUnited Arab EmiratesUnited KingdomUnited StatesUruguayVanuatuVenezuela, RBVietnamWest Bank and GazaWorldYemen, Rep.ZambiaZimbabwe Linea del tempo:
Questa scala temporale mostra un grafico dal 1976 anno al 2015 anno. Cyprus. I dati fino ad 1975 anno non disponibili. Il numero di osservazioni attuali secondo i date: 40.
La fonte (nome):
Indicatori dello sviluppo mondiale
La fonte (organizzazione):
International Monetary Fund, Government Finance Statistics Yearbook and data files, and World Bank and OECD GDP estimates.
Categorie:
Economy & Growth, Public Sector
sono stati aggiornati
23 apr 2017 anni
Indicatori delle variazioni dei valori per anni
Minima:
22.501
1 gen 1980 anni
Massimo:
63.146
1 gen 2004 anni
Alla data di osservazione
Valore
Variazione assoluta
La variazione rispetto al valore precedente
1 gen 1976 anni
30.214
+30.214
0.0%
1 gen 1977 anni
25.882
-4.332
-14.34%
1 gen 1978 anni
23.344
-2.538
-9.8%
1 gen 1979 anni
23.743
+0.399
1.71%
1 gen 1980 anni
22.501
-1.243
-5.23%
1 gen 1981 anni
24.51
+2.009
8.93%
1 gen 1982 anni
25.729
+1.219
4.98%
1 gen 1983 anni
26.753
+1.023
3.98%
1 gen 1984 anni
30.543
+3.79
14.17%
1 gen 1985 anni
26.656
-3.887
-12.73%
1 gen 1986 anni
27.2
+0.544
2.04%
1 gen 1987 anni
25.27
-1.931
-7.1%
1 gen 1988 anni
27.373
+2.104
8.33%
1 gen 1989 anni
27.703
+0.329
1.2%
1 gen 1990 anni
27.475
-0.227
-0.82%
1 gen 1991 anni
50.402
+22.926
83.44%
1 gen 1992 anni
51.948
+1.546
3.07%
1 gen 1993 anni
50.699
-1.249
-2.41%
1 gen 1994 anni
50.185
-0.514
-1.01%
1 gen 1995 anni
50.974
+0.789
1.57%
1 gen 1996 anni
46.46
-4.514
-8.86%
1 gen 1997 anni
48.465
+2.005
4.32%
1 gen 1998 anni
50.057
+1.592
3.29%
1 gen 1999 anni
53.387
+3.33
6.65%
1 gen 2000 anni
52.568
-0.819
-1.53%
1 gen 2001 anni
52.775
+0.208
0.4%
1 gen 2002 anni
54.407
+1.631
3.09%
1 gen 2003 anni
56.732
+2.325
4.27%
1 gen 2004 anni
63.146
+6.414
11.31%
1 gen 2005 anni
60.43
-2.716
-4.3%
1 gen 2006 anni
61.984
+1.554
2.57%
1 gen 2007 anni
60.914
-1.07
-1.73%
1 gen 2008 anni
60.205
-0.71
-1.17%
1 gen 2009 anni
61.696
+1.491
2.48%
1 gen 2010 anni
38.715
-22.981
-37.25%
1 gen 2011 anni
38.578
-0.137
-0.35%
1 gen 2012 anni
39.516
+0.938
2.43%
1 gen 2013 anni
40.264
+0.748
1.89%
1 gen 2014 anni
41.08
+0.816
2.03%
1 gen 2015 anni
47.715
+6.634
16.15%
Classificazione dei paesi secondo i statistiche attuali per anni


Commenti: