Questa scala temporale mostra un grafico dal 2000 anno al 2015 anno. Pre-demographic dividend. I dati fino ad 1999 anno non disponibili. Il numero di osservazioni attuali secondo i date: 16.
La fonte (nome):
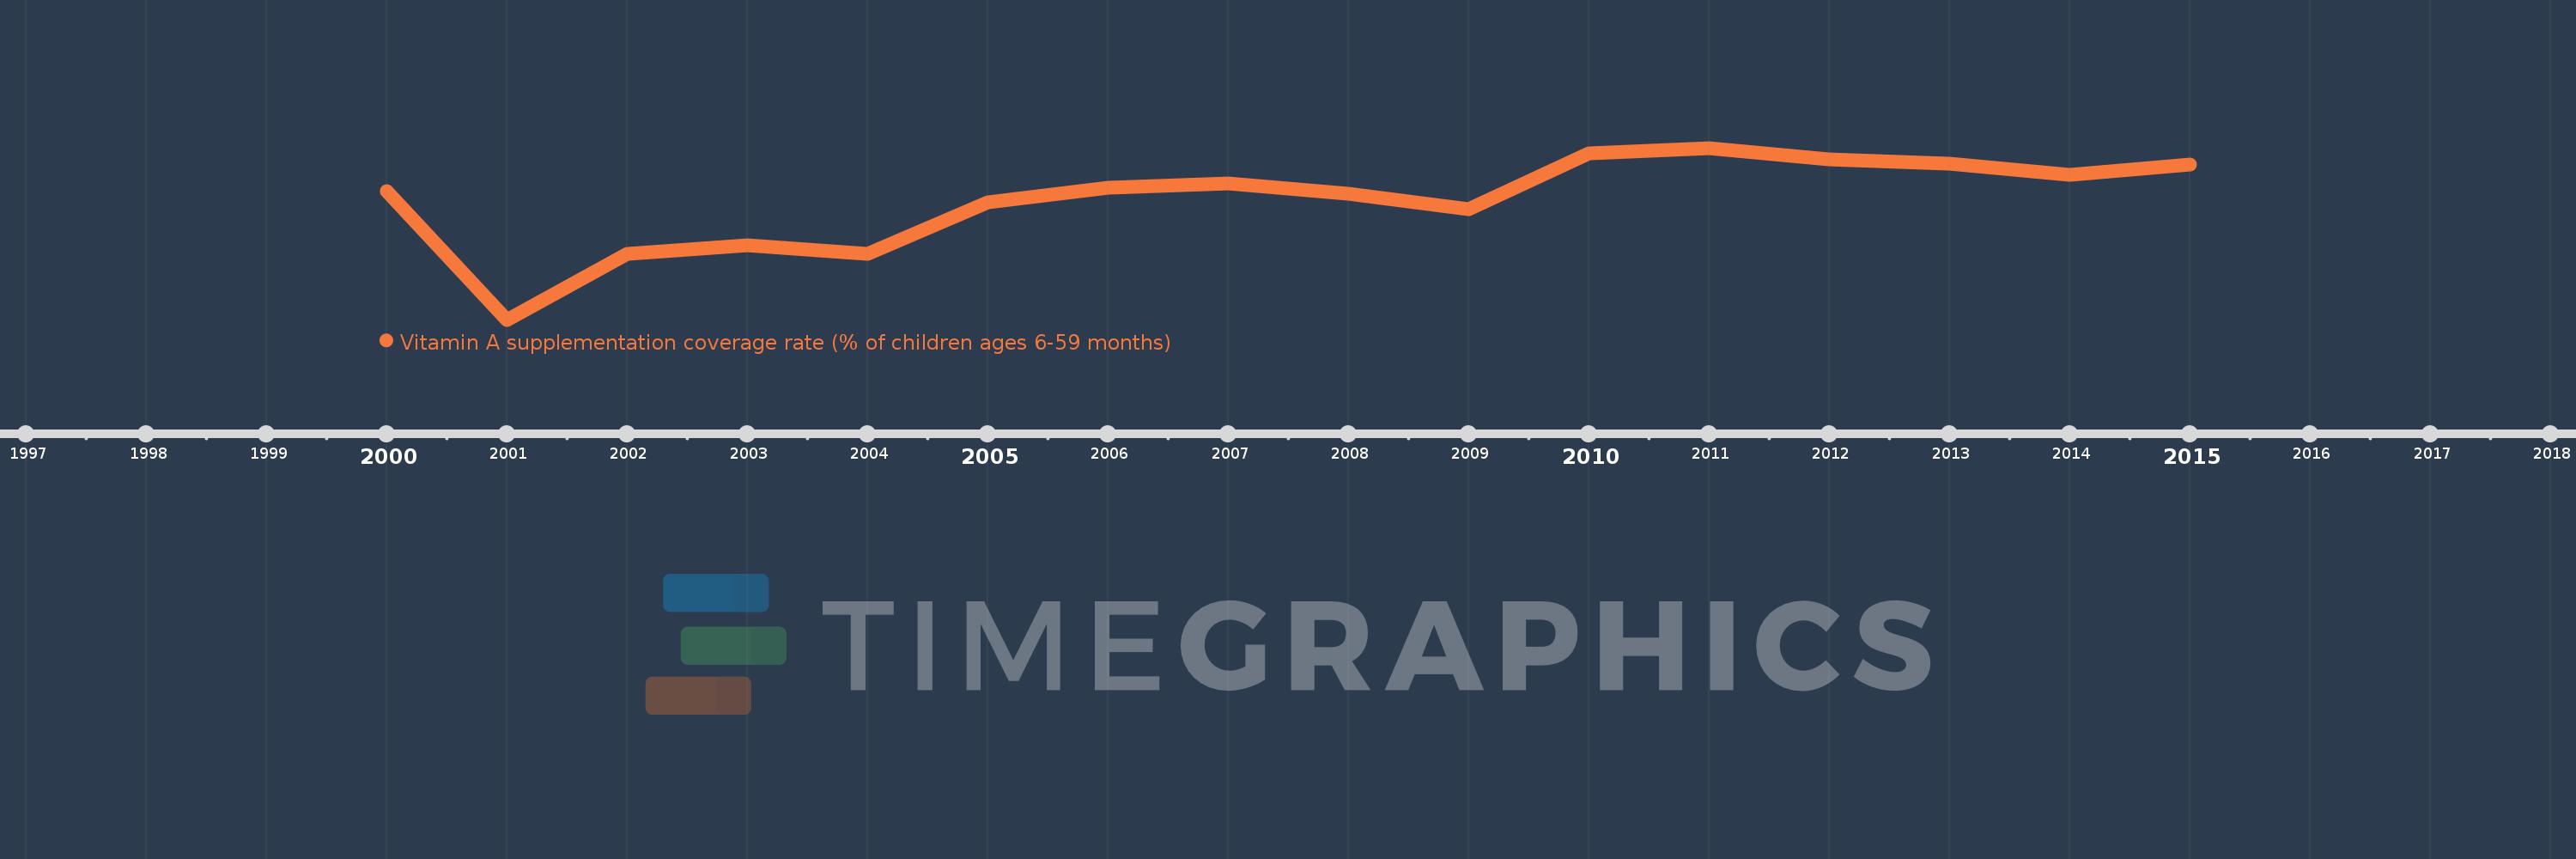
Indicatori dello sviluppo mondiale
La fonte (organizzazione):
United Nations Children's Fund, State of the World's Children.
Categorie:
Health
sono stati aggiornati
23 apr 2017 anni
Indicatori delle variazioni dei valori per anni
In media:
63.497
Minima:
16.81
1 gen 2001 anni
Massimo:
83.987
1 gen 2011 anni
Alla data di osservazione
Valore
Variazione assoluta
La variazione rispetto al valore precedente
1 gen 2000 anni
67.009
+67.009
0.0%
1 gen 2001 anni
16.81
-50.199
-74.91%
1 gen 2002 anni
42.449
+25.64
152.53%
1 gen 2003 anni
45.997
+3.547
8.36%
1 gen 2004 anni
42.72
-3.277
-7.12%
1 gen 2005 anni
62.621
+19.901
46.59%
1 gen 2006 anni
68.431
+5.81
9.28%
1 gen 2007 anni
70.073
+1.642
2.4%
1 gen 2008 anni
65.969
-4.104
-5.86%
1 gen 2009 anni
60.066
-5.904
-8.95%
1 gen 2010 anni
81.734
+21.668
36.07%
1 gen 2011 anni
83.987
+2.253
2.76%
1 gen 2012 anni
79.38
-4.607
-5.49%
1 gen 2013 anni
77.88
-1.5
-1.89%
1 gen 2014 anni
73.435
-4.445
-5.71%
1 gen 2015 anni
77.389
+3.954
5.38%
Classificazione dei paesi secondo i statistiche attuali per anni
