30
/it/
AIzaSyAYiBZKx7MnpbEhh9jyipgxe19OcubqV5w
April 1, 2024
27019
Early-demographic dividend
EAR
false
2
1
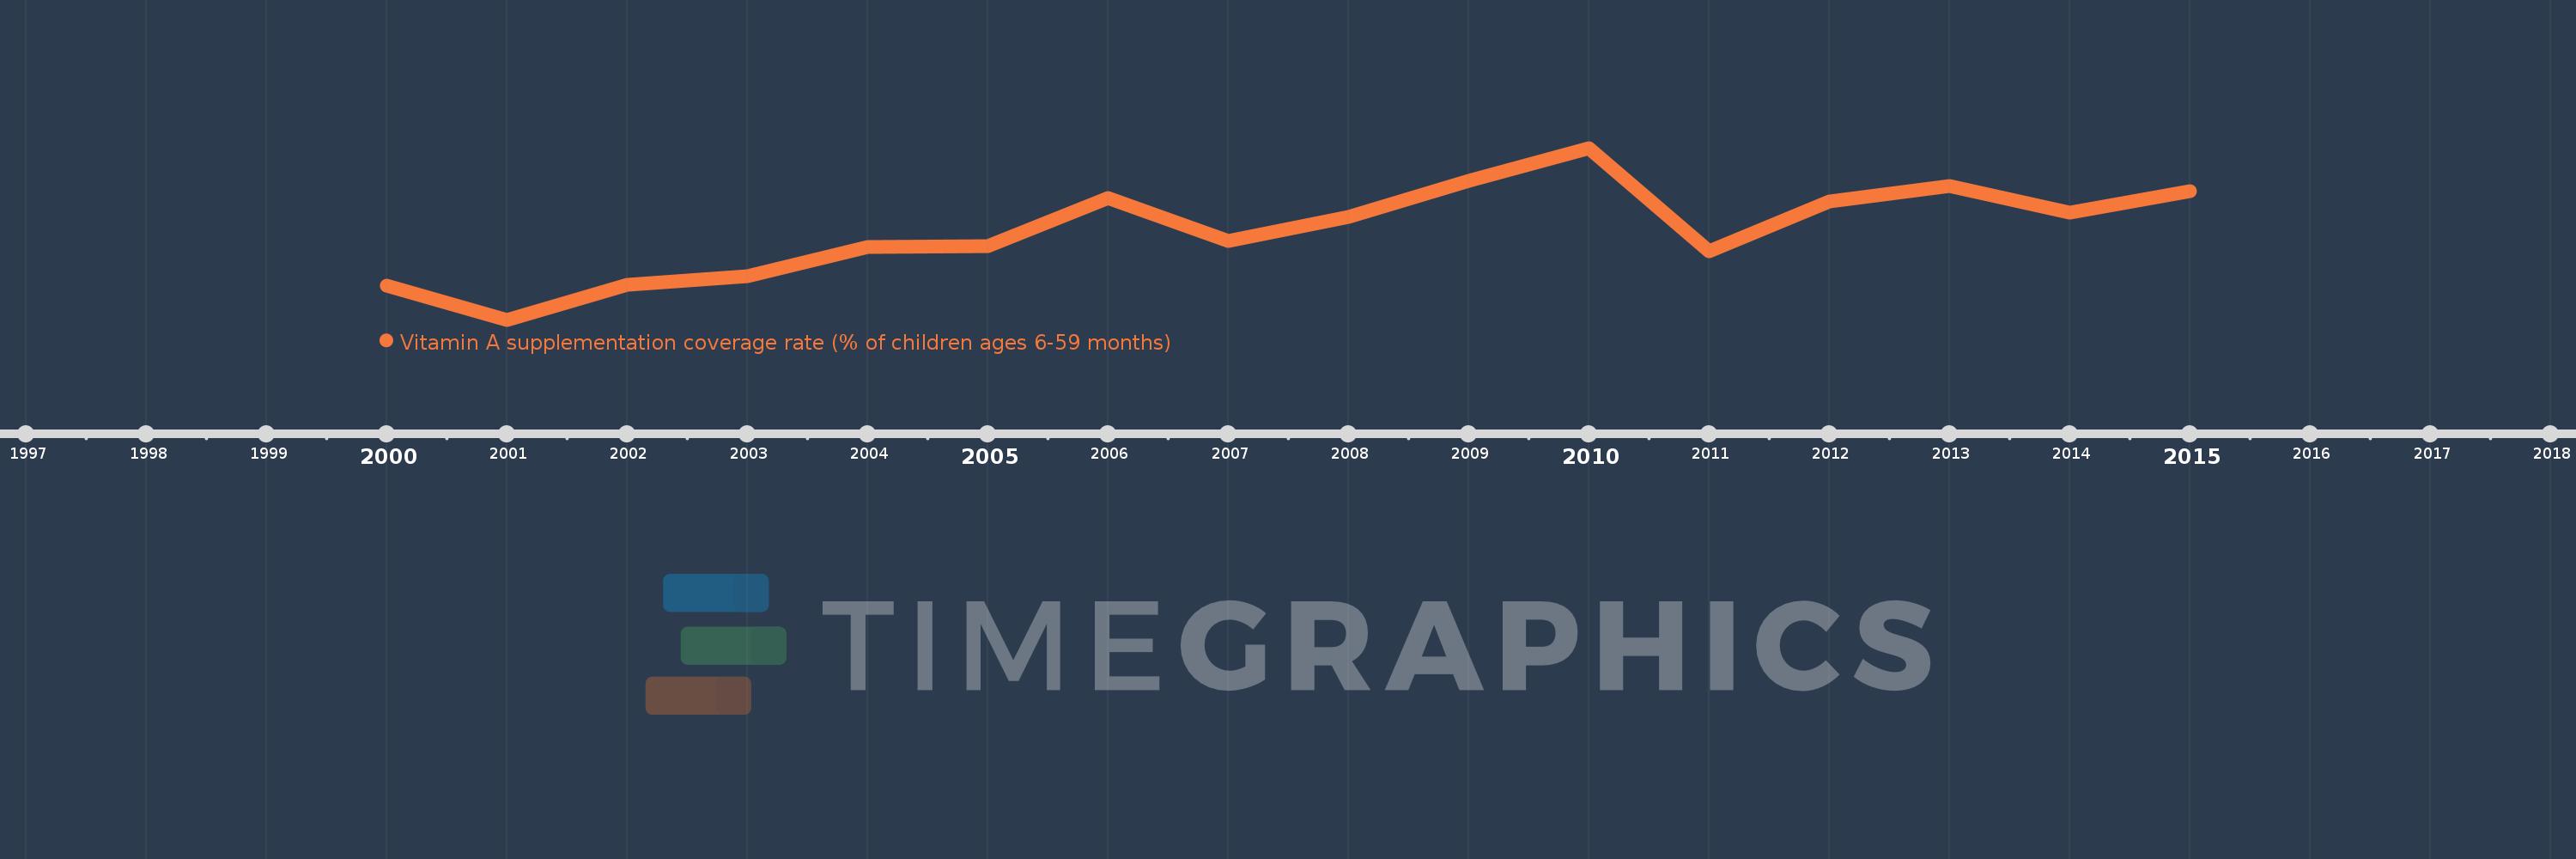
Vitamin A supplementation coverage rate (% of children ages 6-59 months)
2015,2014,2013,2012,2011,2010,2009,2008,2007,2006,2005,2004,2003,2002,2001,2000
