29
/it/
it
AIzaSyAYiBZKx7MnpbEhh9jyipgxe19OcubqV5w
April 1, 2024
54425
Pacific island small states
PSS
false
2
1
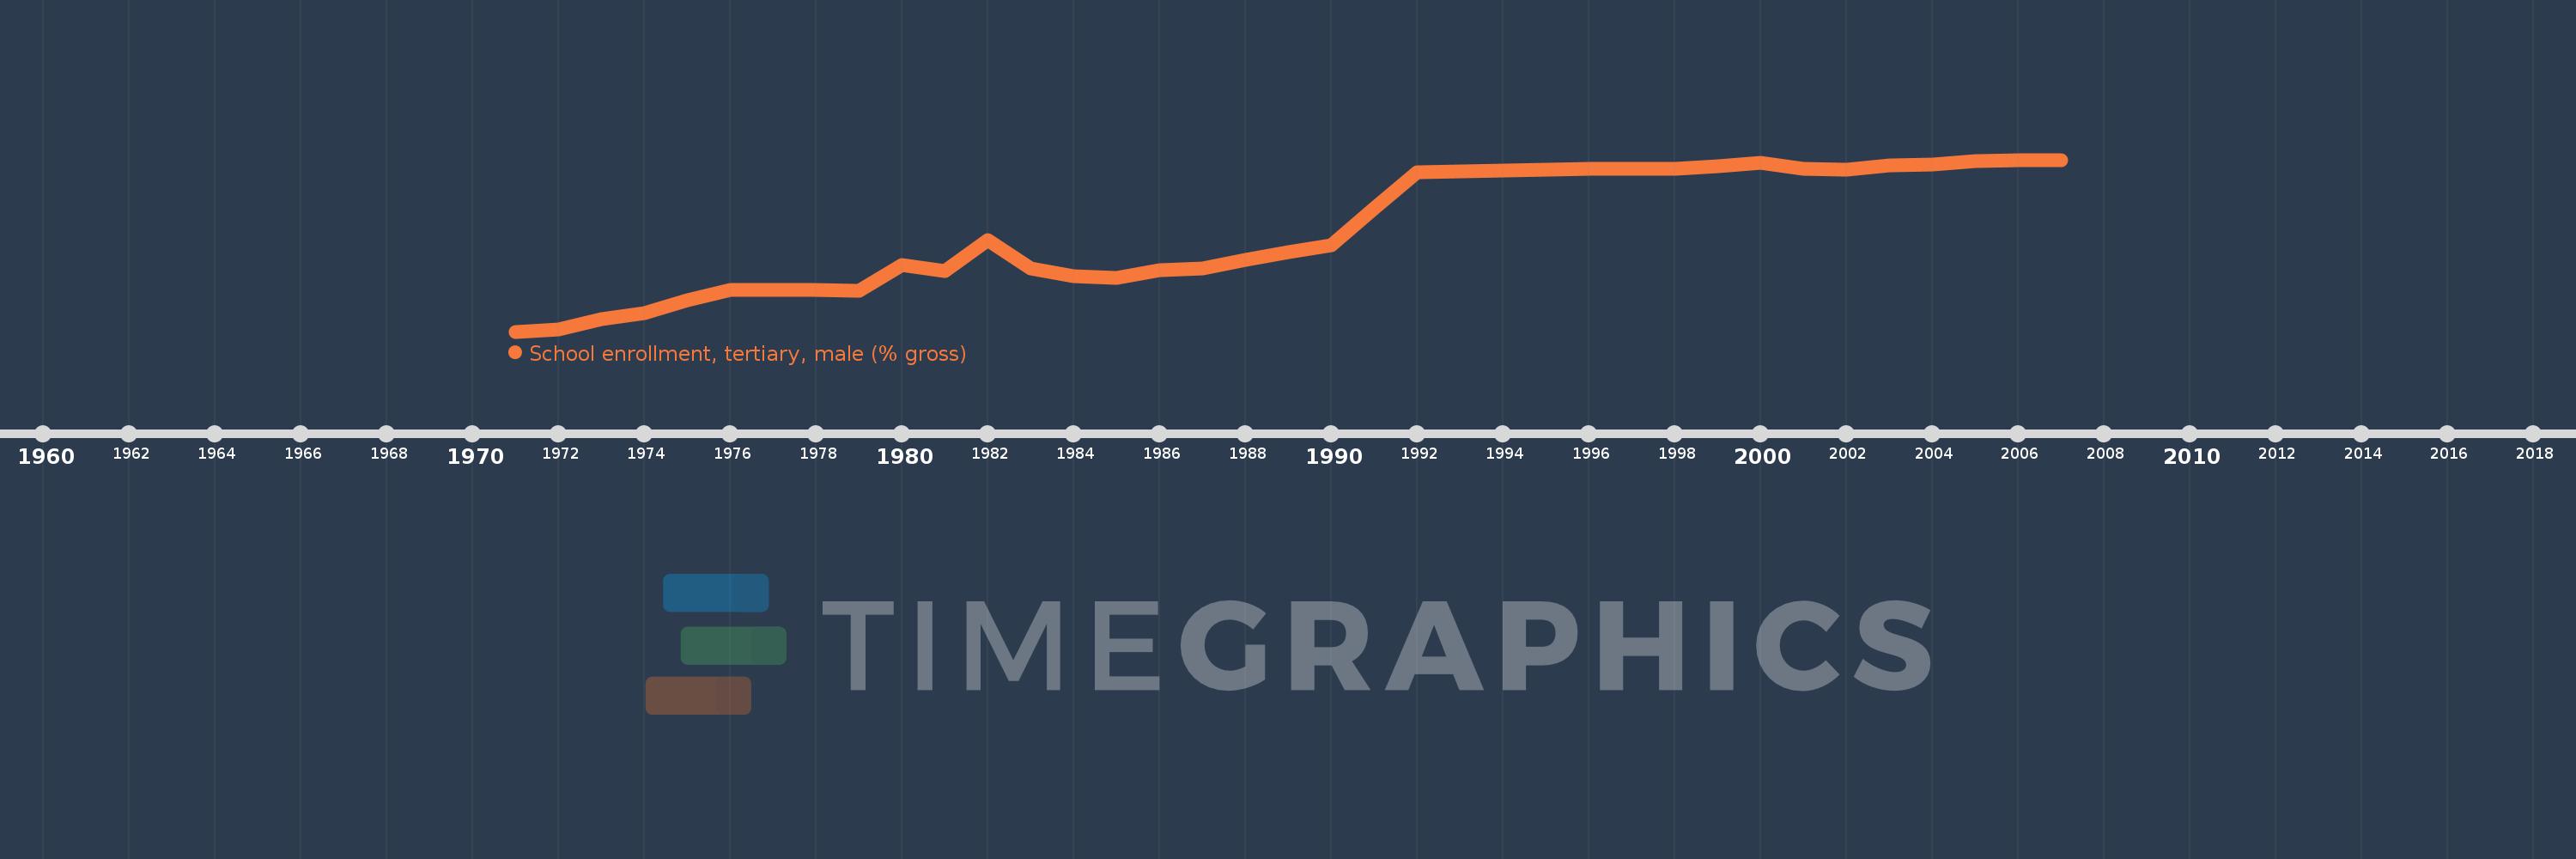
School enrollment, tertiary, male (% gross)
2007,2006,2005,2004,2003,2002,2001,2000,1999,1998,1997,1996,1995,1994,1993,1992,1991,1990,1989,1988,1987,1986,1985,1984,1983,1982,1981,1980,1979,1978,1977,1976,1975,1974,1973,1972,1971
Queste statistiche in altri paesi:
AfghanistanAlbaniaAlgeriaAngolaAntigua and BarbudaArab WorldArgentinaArmeniaArubaAustraliaAustriaAzerbaijanBahamas, TheBahrainBangladeshBarbadosBelarusBelgiumBelizeBeninBermudaBhutanBoliviaBosnia and HerzegovinaBotswanaBrazilBrunei DarussalamBulgariaBurkina FasoBurundiCabo VerdeCambodiaCameroonCanadaCaribbean small statesCentral African RepublicCentral Europe and the BalticsChadChileChinaColombiaComorosCongo, Dem. Rep.Congo, Rep.Costa RicaCote d'IvoireCroatiaCubaCuracaoCyprusCzech RepublicDenmarkDjiboutiDominicaDominican RepublicEarly-demographic dividendEast Asia & PacificEast Asia & Pacific (excluding high income)East Asia & Pacific (IDA & IBRD countries)EcuadorEgypt, Arab Rep.El SalvadorEquatorial GuineaEritreaEstoniaEthiopiaEuro areaEurope & Central AsiaEurope & Central Asia (excluding high income)Europe & Central Asia (IDA & IBRD countries)European UnionFijiFinlandFragile and conflict affected situationsFranceGabonGambia, TheGeorgiaGermanyGhanaGreeceGrenadaGuatemalaGuineaGuinea-BissauGuyanaHaitiHeavily indebted poor countries (HIPC)High incomeHondurasHong Kong SAR, ChinaHungaryIBRD onlyIcelandIDA & IBRD totalIDA blendIDA onlyIDA totalIndiaIndonesiaIran, Islamic Rep.IraqIrelandIsraelItalyJamaicaJapanJordanKazakhstanKenyaKorea, Dem. People’s Rep.Korea, Rep.KuwaitKyrgyz RepublicLao PDRLate-demographic dividendLatin America & Caribbean Latin America & Caribbean (excluding high income)Latin America & the Caribbean (IDA & IBRD countries)LatviaLeast developed countries: UN classificationLebanonLesothoLiberiaLibyaLiechtensteinLithuaniaLow & middle incomeLow incomeLower middle incomeLuxembourgMacao SAR, ChinaMacedonia, FYRMadagascarMalawiMaldivesMaliMaltaMarshall IslandsMauritaniaMauritiusMexicoMicronesia, Fed. Sts.Middle East & North AfricaMiddle East & North Africa (excluding high income)Middle East & North Africa (IDA & IBRD countries)Middle incomeMoldovaMongoliaMontenegroMoroccoMozambiqueMyanmarNamibiaNepalNetherlandsNew ZealandNicaraguaNigerNigeriaNorth AmericaNorwayOECD membersOmanOther small statesPacific island small statesPakistanPalauPanamaPapua New GuineaParaguayPeruPhilippinesPolandPortugalPost-demographic dividendPre-demographic dividendPuerto RicoQatarRomaniaRussian FederationRwandaSamoaSan MarinoSao Tome and PrincipeSaudi ArabiaSenegalSerbiaSeychellesSierra LeoneSingaporeSlovak RepublicSloveniaSmall statesSomaliaSouth AfricaSouth AsiaSouth Asia (IDA & IBRD)SpainSri LankaSt. Kitts and NevisSt. LuciaSt. Vincent and the GrenadinesSub-Saharan Africa Sub-Saharan Africa (excluding high income)Sub-Saharan Africa (IDA & IBRD countries)SudanSurinameSwazilandSwedenSwitzerlandSyrian Arab RepublicTajikistanTanzaniaThailandTimor-LesteTogoTongaTrinidad and TobagoTunisiaTurkeyTurkmenistanUgandaUkraineUnited Arab EmiratesUnited KingdomUnited StatesUpper middle incomeUruguayUzbekistanVanuatuVenezuela, RBVietnamWest Bank and GazaWorldYemen, Rep.ZambiaZimbabwe Linea del tempo:
Questa scala temporale mostra un grafico dal 1971 anno al 2007 anno. Pacific island small states. I dati fino ad 1970 anno non disponibili. Il numero di osservazioni attuali secondo i date: 37.
La fonte (nome):
Indicatori dello sviluppo mondiale
La fonte (organizzazione):
United Nations Educational, Scientific, and Cultural Organization (UNESCO) Institute for Statistics.
Categorie:
Education, Gender
sono stati aggiornati
23 apr 2017 anni
Indicatori delle variazioni dei valori per anni
Minima:
2.015
1 gen 1971 anni
Massimo:
9.052
1 gen 2007 anni
Alla data di osservazione
Valore
Variazione assoluta
La variazione rispetto al valore precedente
1 gen 1971 anni
2.015
+2.015
0.0%
1 gen 1972 anni
2.097
+0.082
4.09%
1 gen 1973 anni
2.529
+0.432
20.61%
1 gen 1974 anni
2.761
+0.232
9.15%
1 gen 1975 anni
3.284
+0.523
18.96%
1 gen 1976 anni
3.721
+0.436
13.28%
1 gen 1977 anni
3.711
-0.01
-0.27%
1 gen 1978 anni
3.709
-0.002
-0.05%
1 gen 1979 anni
3.68
-0.029
-0.78%
1 gen 1980 anni
4.755
+1.075
29.21%
1 gen 1981 anni
4.512
-0.243
-5.1%
1 gen 1982 anni
5.755
+1.243
27.55%
1 gen 1983 anni
4.603
-1.152
-20.01%
1 gen 1984 anni
4.274
-0.33
-7.16%
1 gen 1985 anni
4.198
-0.075
-1.76%
1 gen 1986 anni
4.522
+0.323
7.7%
1 gen 1987 anni
4.594
+0.072
1.6%
1 gen 1988 anni
4.947
+0.354
7.7%
1 gen 1989 anni
5.262
+0.314
6.35%
1 gen 1990 anni
5.542
+0.281
5.33%
1 gen 1991 anni
7.081
+1.539
27.77%
1 gen 1992 anni
8.534
+1.452
20.51%
1 gen 1993 anni
8.569
+0.036
0.42%
1 gen 1994 anni
8.607
+0.037
0.43%
1 gen 1995 anni
8.64
+0.033
0.39%
1 gen 1996 anni
8.669
+0.029
0.34%
1 gen 1997 anni
8.681
+0.012
0.14%
1 gen 1998 anni
8.699
+0.018
0.21%
1 gen 1999 anni
8.782
+0.083
0.95%
1 gen 2000 anni
8.917
+0.134
1.53%
1 gen 2001 anni
8.695
-0.221
-2.48%
1 gen 2002 anni
8.649
-0.047
-0.54%
1 gen 2003 anni
8.811
+0.162
1.88%
1 gen 2004 anni
8.874
+0.063
0.71%
1 gen 2005 anni
8.985
+0.11
1.24%
1 gen 2006 anni
9.052
+0.067
0.75%
1 gen 2007 anni
9.052
+0.0
0.0%
Classificazione dei paesi secondo i statistiche attuali per anni


Commenti: