29
/it/
it
AIzaSyAYiBZKx7MnpbEhh9jyipgxe19OcubqV5w
April 1, 2024
33850
European Union
EUU
false
2
1
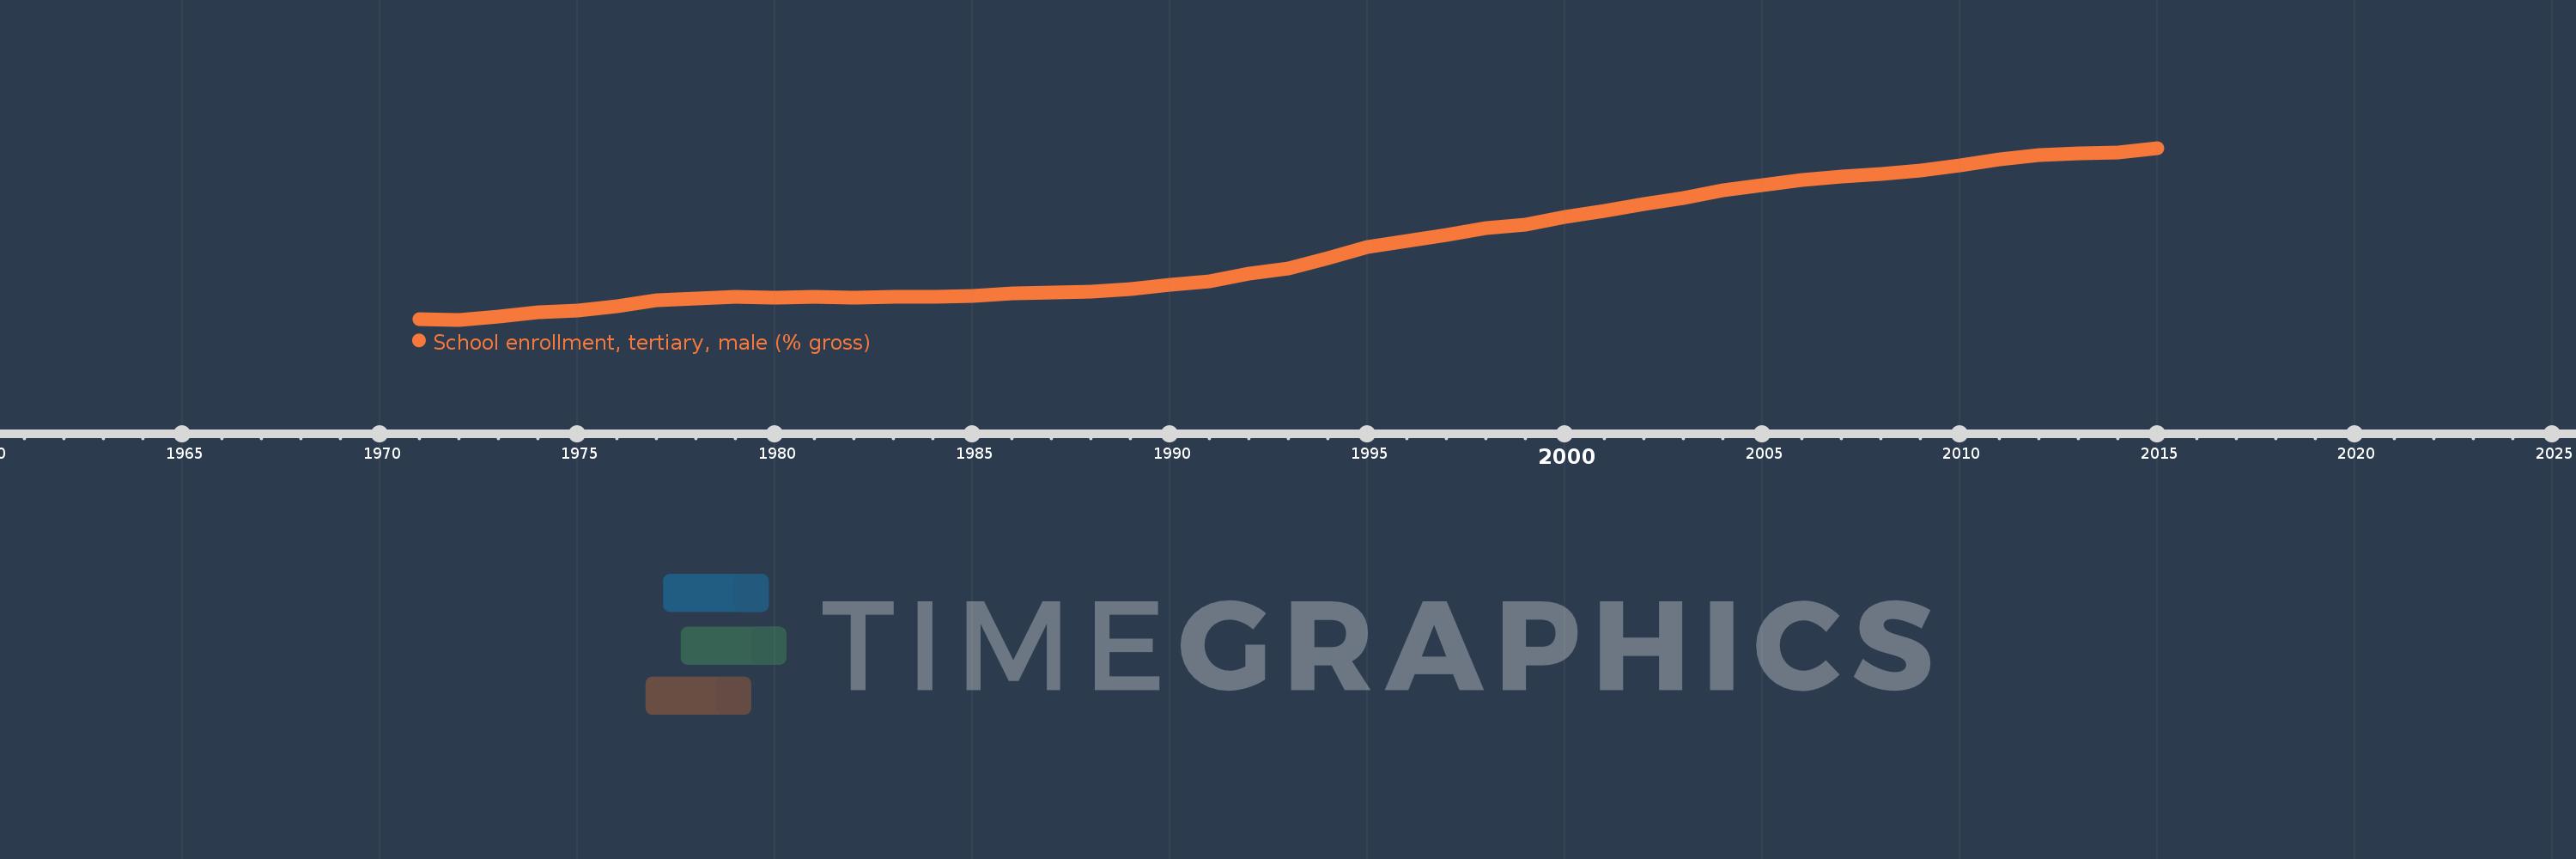
School enrollment, tertiary, male (% gross)
2015,2014,2013,2012,2011,2010,2009,2008,2007,2006,2005,2004,2003,2002,2001,2000,1999,1998,1997,1996,1995,1994,1993,1992,1991,1990,1989,1988,1987,1986,1985,1984,1983,1982,1981,1980,1979,1978,1977,1976,1975,1974,1973,1972,1971
Queste statistiche in altri paesi:
AfghanistanAlbaniaAlgeriaAngolaAntigua and BarbudaArab WorldArgentinaArmeniaArubaAustraliaAustriaAzerbaijanBahamas, TheBahrainBangladeshBarbadosBelarusBelgiumBelizeBeninBermudaBhutanBoliviaBosnia and HerzegovinaBotswanaBrazilBrunei DarussalamBulgariaBurkina FasoBurundiCabo VerdeCambodiaCameroonCanadaCaribbean small statesCentral African RepublicCentral Europe and the BalticsChadChileChinaColombiaComorosCongo, Dem. Rep.Congo, Rep.Costa RicaCote d'IvoireCroatiaCubaCuracaoCyprusCzech RepublicDenmarkDjiboutiDominicaDominican RepublicEarly-demographic dividendEast Asia & PacificEast Asia & Pacific (excluding high income)East Asia & Pacific (IDA & IBRD countries)EcuadorEgypt, Arab Rep.El SalvadorEquatorial GuineaEritreaEstoniaEthiopiaEuro areaEurope & Central AsiaEurope & Central Asia (excluding high income)Europe & Central Asia (IDA & IBRD countries)European UnionFijiFinlandFragile and conflict affected situationsFranceGabonGambia, TheGeorgiaGermanyGhanaGreeceGrenadaGuatemalaGuineaGuinea-BissauGuyanaHaitiHeavily indebted poor countries (HIPC)High incomeHondurasHong Kong SAR, ChinaHungaryIBRD onlyIcelandIDA & IBRD totalIDA blendIDA onlyIDA totalIndiaIndonesiaIran, Islamic Rep.IraqIrelandIsraelItalyJamaicaJapanJordanKazakhstanKenyaKorea, Dem. People’s Rep.Korea, Rep.KuwaitKyrgyz RepublicLao PDRLate-demographic dividendLatin America & Caribbean Latin America & Caribbean (excluding high income)Latin America & the Caribbean (IDA & IBRD countries)LatviaLeast developed countries: UN classificationLebanonLesothoLiberiaLibyaLiechtensteinLithuaniaLow & middle incomeLow incomeLower middle incomeLuxembourgMacao SAR, ChinaMacedonia, FYRMadagascarMalawiMaldivesMaliMaltaMarshall IslandsMauritaniaMauritiusMexicoMicronesia, Fed. Sts.Middle East & North AfricaMiddle East & North Africa (excluding high income)Middle East & North Africa (IDA & IBRD countries)Middle incomeMoldovaMongoliaMontenegroMoroccoMozambiqueMyanmarNamibiaNepalNetherlandsNew ZealandNicaraguaNigerNigeriaNorth AmericaNorwayOECD membersOmanOther small statesPacific island small statesPakistanPalauPanamaPapua New GuineaParaguayPeruPhilippinesPolandPortugalPost-demographic dividendPre-demographic dividendPuerto RicoQatarRomaniaRussian FederationRwandaSamoaSan MarinoSao Tome and PrincipeSaudi ArabiaSenegalSerbiaSeychellesSierra LeoneSingaporeSlovak RepublicSloveniaSmall statesSomaliaSouth AfricaSouth AsiaSouth Asia (IDA & IBRD)SpainSri LankaSt. Kitts and NevisSt. LuciaSt. Vincent and the GrenadinesSub-Saharan Africa Sub-Saharan Africa (excluding high income)Sub-Saharan Africa (IDA & IBRD countries)SudanSurinameSwazilandSwedenSwitzerlandSyrian Arab RepublicTajikistanTanzaniaThailandTimor-LesteTogoTongaTrinidad and TobagoTunisiaTurkeyTurkmenistanUgandaUkraineUnited Arab EmiratesUnited KingdomUnited StatesUpper middle incomeUruguayUzbekistanVanuatuVenezuela, RBVietnamWest Bank and GazaWorldYemen, Rep.ZambiaZimbabwe Linea del tempo:
Questa scala temporale mostra un grafico dal 1971 anno al 2015 anno. European Union. I dati fino ad 1970 anno non disponibili. Il numero di osservazioni attuali secondo i date: 45.
La fonte (nome):
Indicatori dello sviluppo mondiale
La fonte (organizzazione):
United Nations Educational, Scientific, and Cultural Organization (UNESCO) Institute for Statistics.
Categorie:
Education, Gender
sono stati aggiornati
23 apr 2017 anni
Indicatori delle variazioni dei valori per anni
Minima:
20.183
1 gen 1972 anni
Massimo:
60.826
1 gen 2015 anni
Alla data di osservazione
Valore
Variazione assoluta
La variazione rispetto al valore precedente
1 gen 1971 anni
20.24
+20.24
0.0%
1 gen 1972 anni
20.183
-0.057
-0.28%
1 gen 1973 anni
21.003
+0.82
4.06%
1 gen 1974 anni
21.88
+0.877
4.18%
1 gen 1975 anni
22.412
+0.532
2.43%
1 gen 1976 anni
23.466
+1.054
4.7%
1 gen 1977 anni
24.719
+1.253
5.34%
1 gen 1978 anni
25.154
+0.435
1.76%
1 gen 1979 anni
25.594
+0.44
1.75%
1 gen 1980 anni
25.365
-0.228
-0.89%
1 gen 1981 anni
25.574
+0.209
0.82%
1 gen 1982 anni
25.475
-0.1
-0.39%
1 gen 1983 anni
25.575
+0.101
0.4%
1 gen 1984 anni
25.594
+0.018
0.07%
1 gen 1985 anni
25.879
+0.285
1.12%
1 gen 1986 anni
26.378
+0.499
1.93%
1 gen 1987 anni
26.665
+0.287
1.09%
1 gen 1988 anni
26.923
+0.258
0.97%
1 gen 1989 anni
27.491
+0.569
2.11%
1 gen 1990 anni
28.42
+0.929
3.38%
1 gen 1991 anni
29.34
+0.919
3.23%
1 gen 1992 anni
31.021
+1.682
5.73%
1 gen 1993 anni
32.363
+1.342
4.33%
1 gen 1994 anni
34.707
+2.344
7.24%
1 gen 1995 anni
37.484
+2.777
8.0%
1 gen 1996 anni
38.719
+1.235
3.3%
1 gen 1997 anni
40.271
+1.551
4.01%
1 gen 1998 anni
41.846
+1.575
3.91%
1 gen 1999 anni
42.643
+0.797
1.9%
1 gen 2000 anni
44.593
+1.95
4.57%
1 gen 2001 anni
45.924
+1.332
2.99%
1 gen 2002 anni
47.629
+1.704
3.71%
1 gen 2003 anni
49.067
+1.439
3.02%
1 gen 2004 anni
50.778
+1.711
3.49%
1 gen 2005 anni
51.973
+1.195
2.35%
1 gen 2006 anni
53.247
+1.273
2.45%
1 gen 2007 anni
54.11
+0.863
1.62%
1 gen 2008 anni
54.736
+0.626
1.16%
1 gen 2009 anni
55.525
+0.789
1.44%
1 gen 2010 anni
56.699
+1.174
2.11%
1 gen 2011 anni
58.094
+1.394
2.46%
1 gen 2012 anni
59.111
+1.018
1.75%
1 gen 2013 anni
59.603
+0.492
0.83%
1 gen 2014 anni
59.73
+0.127
0.21%
1 gen 2015 anni
60.826
+1.096
1.83%
Classificazione dei paesi secondo i statistiche attuali per anni


Commenti: