29
/it/
it
AIzaSyAYiBZKx7MnpbEhh9jyipgxe19OcubqV5w
April 1, 2024
54364
Pacific island small states
PSS
false
2
1
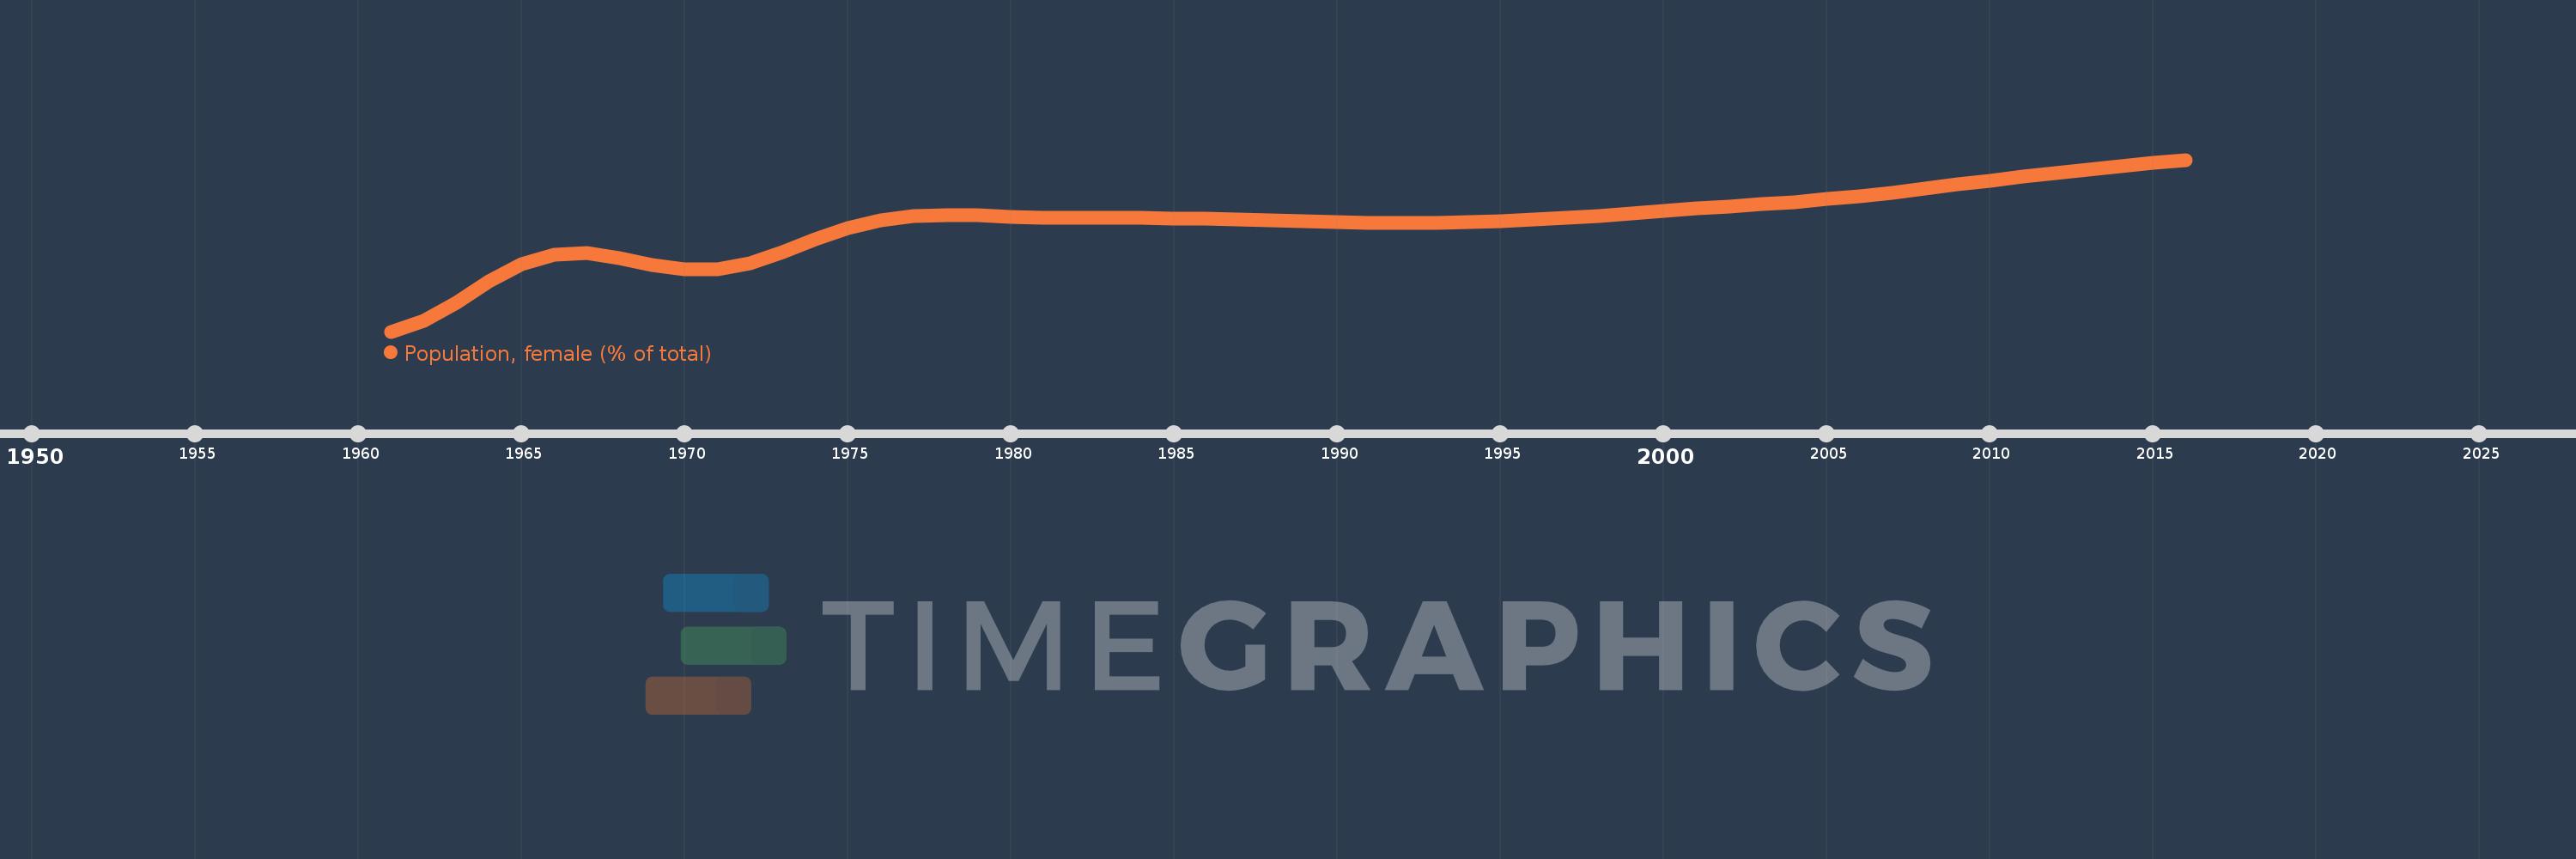
Population, female (% of total)
2016,2015,2014,2013,2012,2011,2010,2009,2008,2007,2006,2005,2004,2003,2002,2001,2000,1999,1998,1997,1996,1995,1994,1993,1992,1991,1990,1989,1988,1987,1986,1985,1984,1983,1982,1981,1980,1979,1978,1977,1976,1975,1974,1973,1972,1971,1970,1969,1968,1967,1966,1965,1964,1963,1962,1961
Queste statistiche in altri paesi:
AfghanistanAlbaniaAlgeriaAngolaAntigua and BarbudaArab WorldArgentinaArmeniaArubaAustraliaAustriaAzerbaijanBahamas, TheBahrainBangladeshBarbadosBelarusBelgiumBelizeBeninBhutanBoliviaBosnia and HerzegovinaBotswanaBrazilBrunei DarussalamBulgariaBurkina FasoBurundiCabo VerdeCambodiaCameroonCanadaCaribbean small statesCentral African RepublicCentral Europe and the BalticsChadChannel IslandsChileChinaColombiaComorosCongo, Dem. Rep.Congo, Rep.Costa RicaCote d'IvoireCroatiaCubaCuracaoCyprusCzech RepublicDenmarkDjiboutiDominican RepublicEarly-demographic dividendEast Asia & PacificEast Asia & Pacific (excluding high income)East Asia & Pacific (IDA & IBRD countries)EcuadorEgypt, Arab Rep.El SalvadorEquatorial GuineaEritreaEstoniaEthiopiaEuro areaEurope & Central AsiaEurope & Central Asia (excluding high income)Europe & Central Asia (IDA & IBRD countries)European UnionFijiFinlandFragile and conflict affected situationsFranceFrench PolynesiaGabonGambia, TheGeorgiaGermanyGhanaGreeceGrenadaGuamGuatemalaGuineaGuinea-BissauGuyanaHaitiHeavily indebted poor countries (HIPC)High incomeHondurasHong Kong SAR, ChinaHungaryIBRD onlyIcelandIDA & IBRD totalIDA blendIDA onlyIDA totalIndiaIndonesiaIran, Islamic Rep.IraqIrelandIsraelItalyJamaicaJapanJordanKazakhstanKenyaKiribatiKorea, Dem. People’s Rep.Korea, Rep.KosovoKuwaitKyrgyz RepublicLao PDRLate-demographic dividendLatin America & Caribbean Latin America & Caribbean (excluding high income)Latin America & the Caribbean (IDA & IBRD countries)LatviaLeast developed countries: UN classificationLebanonLesothoLiberiaLibyaLithuaniaLow & middle incomeLow incomeLower middle incomeLuxembourgMacao SAR, ChinaMacedonia, FYRMadagascarMalawiMalaysiaMaldivesMaliMaltaMauritaniaMauritiusMexicoMicronesia, Fed. Sts.Middle East & North AfricaMiddle East & North Africa (excluding high income)Middle East & North Africa (IDA & IBRD countries)Middle incomeMoldovaMongoliaMontenegroMoroccoMozambiqueMyanmarNamibiaNepalNetherlandsNew CaledoniaNew ZealandNicaraguaNigerNigeriaNorth AmericaNorwayOECD membersOmanOther small statesPacific island small statesPakistanPanamaPapua New GuineaParaguayPeruPhilippinesPolandPortugalPost-demographic dividendPre-demographic dividendPuerto RicoQatarRomaniaRussian FederationRwandaSamoaSao Tome and PrincipeSaudi ArabiaSenegalSerbiaSeychellesSierra LeoneSingaporeSlovak RepublicSloveniaSmall statesSolomon IslandsSomaliaSouth AfricaSouth AsiaSouth Asia (IDA & IBRD)South SudanSpainSri LankaSt. LuciaSt. Vincent and the GrenadinesSub-Saharan Africa Sub-Saharan Africa (excluding high income)Sub-Saharan Africa (IDA & IBRD countries)SudanSurinameSwazilandSwedenSwitzerlandSyrian Arab RepublicTajikistanTanzaniaThailandTimor-LesteTogoTongaTrinidad and TobagoTunisiaTurkeyTurkmenistanUgandaUkraineUnited Arab EmiratesUnited KingdomUnited StatesUpper middle incomeUruguayUzbekistanVanuatuVenezuela, RBVietnamVirgin Islands (U.S.)West Bank and GazaWorldYemen, Rep.ZambiaZimbabwe Linea del tempo:
Questa scala temporale mostra un grafico dal 1961 anno al 2016 anno. Pacific island small states. I dati fino ad 1960 anno non disponibili. Il numero di osservazioni attuali secondo i date: 56.
La fonte (nome):
Indicatori dello sviluppo mondiale
La fonte (organizzazione):
World Bank staff estimates based on male/female distributions of United Nations Population Division's World Population Prospects.
Categorie:
Health
sono stati aggiornati
23 apr 2017 anni
Indicatori delle variazioni dei valori per anni
Minima:
48.442
1 gen 1961 anni
Massimo:
49.225
1 gen 2016 anni
Alla data di osservazione
Valore
Variazione assoluta
La variazione rispetto al valore precedente
1 gen 1961 anni
48.442
+48.442
0.0%
1 gen 1962 anni
48.49
+0.048
0.1%
1 gen 1963 anni
48.574
+0.084
0.17%
1 gen 1964 anni
48.67
+0.096
0.2%
1 gen 1965 anni
48.749
+0.079
0.16%
1 gen 1966 anni
48.794
+0.044
0.09%
1 gen 1967 anni
48.8
+0.006
0.01%
1 gen 1968 anni
48.778
-0.021
-0.04%
1 gen 1969 anni
48.746
-0.032
-0.07%
1 gen 1970 anni
48.724
-0.022
-0.04%
1 gen 1971 anni
48.726
+0.002
0.0%
1 gen 1972 anni
48.755
+0.029
0.06%
1 gen 1973 anni
48.804
+0.049
0.1%
1 gen 1974 anni
48.861
+0.057
0.12%
1 gen 1975 anni
48.913
+0.052
0.11%
1 gen 1976 anni
48.949
+0.036
0.07%
1 gen 1977 anni
48.968
+0.019
0.04%
1 gen 1978 anni
48.974
+0.006
0.01%
1 gen 1979 anni
48.971
-0.003
-0.01%
1 gen 1980 anni
48.966
-0.005
-0.01%
1 gen 1981 anni
48.962
-0.004
-0.01%
1 gen 1982 anni
48.96
-0.002
0.0%
1 gen 1983 anni
48.959
-0.001
0.0%
1 gen 1984 anni
48.959
-0.001
0.0%
1 gen 1985 anni
48.958
-0.001
0.0%
1 gen 1986 anni
48.955
-0.002
0.0%
1 gen 1987 anni
48.952
-0.004
-0.01%
1 gen 1988 anni
48.948
-0.004
-0.01%
1 gen 1989 anni
48.944
-0.004
-0.01%
1 gen 1990 anni
48.941
-0.003
-0.01%
1 gen 1991 anni
48.939
-0.002
0.0%
1 gen 1992 anni
48.938
0.0
0.0%
1 gen 1993 anni
48.939
+0.001
0.0%
1 gen 1994 anni
48.942
+0.003
0.01%
1 gen 1995 anni
48.946
+0.004
0.01%
1 gen 1996 anni
48.952
+0.006
0.01%
1 gen 1997 anni
48.96
+0.008
0.02%
1 gen 1998 anni
48.97
+0.01
0.02%
1 gen 1999 anni
48.98
+0.011
0.02%
1 gen 2000 anni
48.992
+0.011
0.02%
1 gen 2001 anni
49.002
+0.011
0.02%
1 gen 2002 anni
49.013
+0.01
0.02%
1 gen 2003 anni
49.023
+0.01
0.02%
1 gen 2004 anni
49.033
+0.01
0.02%
1 gen 2005 anni
49.045
+0.012
0.02%
1 gen 2006 anni
49.059
+0.014
0.03%
1 gen 2007 anni
49.075
+0.016
0.03%
1 gen 2008 anni
49.093
+0.018
0.04%
1 gen 2009 anni
49.112
+0.019
0.04%
1 gen 2010 anni
49.131
+0.019
0.04%
1 gen 2011 anni
49.148
+0.018
0.04%
1 gen 2012 anni
49.165
+0.016
0.03%
1 gen 2013 anni
49.18
+0.015
0.03%
1 gen 2014 anni
49.195
+0.015
0.03%
1 gen 2015 anni
49.21
+0.015
0.03%
1 gen 2016 anni
49.225
+0.015
0.03%
Classificazione dei paesi secondo i statistiche attuali per anni


Commenti: