29
/it/
it
AIzaSyAYiBZKx7MnpbEhh9jyipgxe19OcubqV5w
April 1, 2024
173349
Kyrgyz Republic
KGZ
true
2
1
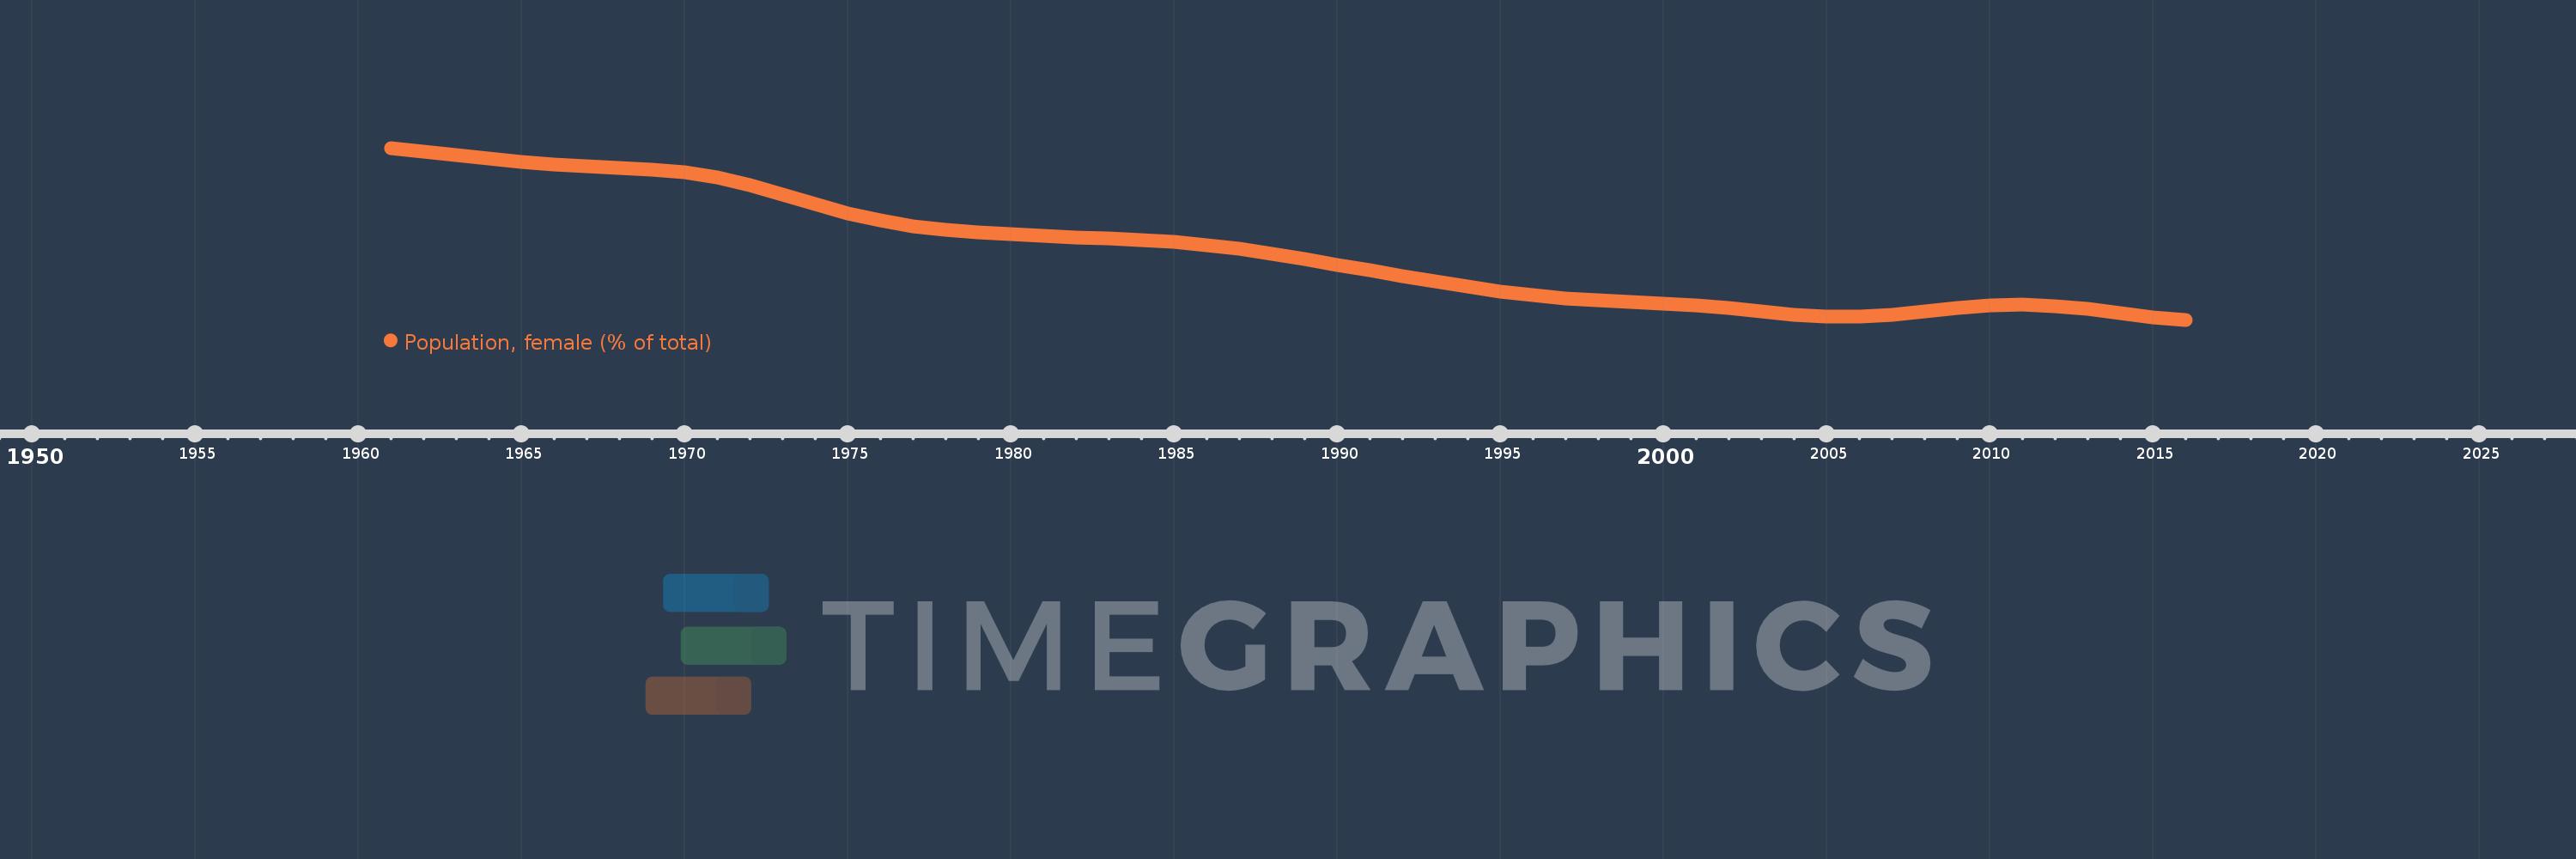
Population, female (% of total)
2016,2015,2014,2013,2012,2011,2010,2009,2008,2007,2006,2005,2004,2003,2002,2001,2000,1999,1998,1997,1996,1995,1994,1993,1992,1991,1990,1989,1988,1987,1986,1985,1984,1983,1982,1981,1980,1979,1978,1977,1976,1975,1974,1973,1972,1971,1970,1969,1968,1967,1966,1965,1964,1963,1962,1961
Queste statistiche in altri paesi:
AfghanistanAlbaniaAlgeriaAngolaAntigua and BarbudaArab WorldArgentinaArmeniaArubaAustraliaAustriaAzerbaijanBahamas, TheBahrainBangladeshBarbadosBelarusBelgiumBelizeBeninBhutanBoliviaBosnia and HerzegovinaBotswanaBrazilBrunei DarussalamBulgariaBurkina FasoBurundiCabo VerdeCambodiaCameroonCanadaCaribbean small statesCentral African RepublicCentral Europe and the BalticsChadChannel IslandsChileChinaColombiaComorosCongo, Dem. Rep.Congo, Rep.Costa RicaCote d'IvoireCroatiaCubaCuracaoCyprusCzech RepublicDenmarkDjiboutiDominican RepublicEarly-demographic dividendEast Asia & PacificEast Asia & Pacific (excluding high income)East Asia & Pacific (IDA & IBRD countries)EcuadorEgypt, Arab Rep.El SalvadorEquatorial GuineaEritreaEstoniaEthiopiaEuro areaEurope & Central AsiaEurope & Central Asia (excluding high income)Europe & Central Asia (IDA & IBRD countries)European UnionFijiFinlandFragile and conflict affected situationsFranceFrench PolynesiaGabonGambia, TheGeorgiaGermanyGhanaGreeceGrenadaGuamGuatemalaGuineaGuinea-BissauGuyanaHaitiHeavily indebted poor countries (HIPC)High incomeHondurasHong Kong SAR, ChinaHungaryIBRD onlyIcelandIDA & IBRD totalIDA blendIDA onlyIDA totalIndiaIndonesiaIran, Islamic Rep.IraqIrelandIsraelItalyJamaicaJapanJordanKazakhstanKenyaKiribatiKorea, Dem. People’s Rep.Korea, Rep.KosovoKuwaitKyrgyz RepublicLao PDRLate-demographic dividendLatin America & Caribbean Latin America & Caribbean (excluding high income)Latin America & the Caribbean (IDA & IBRD countries)LatviaLeast developed countries: UN classificationLebanonLesothoLiberiaLibyaLithuaniaLow & middle incomeLow incomeLower middle incomeLuxembourgMacao SAR, ChinaMacedonia, FYRMadagascarMalawiMalaysiaMaldivesMaliMaltaMauritaniaMauritiusMexicoMicronesia, Fed. Sts.Middle East & North AfricaMiddle East & North Africa (excluding high income)Middle East & North Africa (IDA & IBRD countries)Middle incomeMoldovaMongoliaMontenegroMoroccoMozambiqueMyanmarNamibiaNepalNetherlandsNew CaledoniaNew ZealandNicaraguaNigerNigeriaNorth AmericaNorwayOECD membersOmanOther small statesPacific island small statesPakistanPanamaPapua New GuineaParaguayPeruPhilippinesPolandPortugalPost-demographic dividendPre-demographic dividendPuerto RicoQatarRomaniaRussian FederationRwandaSamoaSao Tome and PrincipeSaudi ArabiaSenegalSerbiaSeychellesSierra LeoneSingaporeSlovak RepublicSloveniaSmall statesSolomon IslandsSomaliaSouth AfricaSouth AsiaSouth Asia (IDA & IBRD)South SudanSpainSri LankaSt. LuciaSt. Vincent and the GrenadinesSub-Saharan Africa Sub-Saharan Africa (excluding high income)Sub-Saharan Africa (IDA & IBRD countries)SudanSurinameSwazilandSwedenSwitzerlandSyrian Arab RepublicTajikistanTanzaniaThailandTimor-LesteTogoTongaTrinidad and TobagoTunisiaTurkeyTurkmenistanUgandaUkraineUnited Arab EmiratesUnited KingdomUnited StatesUpper middle incomeUruguayUzbekistanVanuatuVenezuela, RBVietnamVirgin Islands (U.S.)West Bank and GazaWorldYemen, Rep.ZambiaZimbabwe Linea del tempo:
Questa scala temporale mostra un grafico dal 1961 anno al 2016 anno. Kyrgyz Republic. I dati fino ad 1960 anno non disponibili. Il numero di osservazioni attuali secondo i date: 56.
La fonte (nome):
Indicatori dello sviluppo mondiale
La fonte (organizzazione):
World Bank staff estimates based on male/female distributions of United Nations Population Division's World Population Prospects.
Categorie:
Health
sono stati aggiornati
23 apr 2017 anni
Indicatori delle variazioni dei valori per anni
Minima:
50.502
1 gen 2016 anni
Massimo:
52.561
1 gen 1961 anni
Alla data di osservazione
Valore
Variazione assoluta
La variazione rispetto al valore precedente
1 gen 1961 anni
52.561
+52.561
0.0%
1 gen 1962 anni
52.519
-0.042
-0.08%
1 gen 1963 anni
52.474
-0.045
-0.09%
1 gen 1964 anni
52.43
-0.044
-0.08%
1 gen 1965 anni
52.391
-0.039
-0.07%
1 gen 1966 anni
52.359
-0.032
-0.06%
1 gen 1967 anni
52.337
-0.022
-0.04%
1 gen 1968 anni
52.322
-0.015
-0.03%
1 gen 1969 anni
52.303
-0.019
-0.04%
1 gen 1970 anni
52.266
-0.037
-0.07%
1 gen 1971 anni
52.203
-0.062
-0.12%
1 gen 1972 anni
52.114
-0.09
-0.17%
1 gen 1973 anni
52.003
-0.111
-0.21%
1 gen 1974 anni
51.884
-0.118
-0.23%
1 gen 1975 anni
51.776
-0.108
-0.21%
1 gen 1976 anni
51.689
-0.087
-0.17%
1 gen 1977 anni
51.625
-0.063
-0.12%
1 gen 1978 anni
51.581
-0.045
-0.09%
1 gen 1979 anni
51.55
-0.031
-0.06%
1 gen 1980 anni
51.527
-0.023
-0.04%
1 gen 1981 anni
51.507
-0.02
-0.04%
1 gen 1982 anni
51.49
-0.017
-0.03%
1 gen 1983 anni
51.475
-0.015
-0.03%
1 gen 1984 anni
51.458
-0.017
-0.03%
1 gen 1985 anni
51.434
-0.025
-0.05%
1 gen 1986 anni
51.398
-0.036
-0.07%
1 gen 1987 anni
51.35
-0.048
-0.09%
1 gen 1988 anni
51.292
-0.058
-0.11%
1 gen 1989 anni
51.227
-0.065
-0.13%
1 gen 1990 anni
51.16
-0.067
-0.13%
1 gen 1991 anni
51.093
-0.066
-0.13%
1 gen 1992 anni
51.027
-0.066
-0.13%
1 gen 1993 anni
50.962
-0.066
-0.13%
1 gen 1994 anni
50.898
-0.063
-0.12%
1 gen 1995 anni
50.841
-0.057
-0.11%
1 gen 1996 anni
50.794
-0.048
-0.09%
1 gen 1997 anni
50.758
-0.036
-0.07%
1 gen 1998 anni
50.733
-0.025
-0.05%
1 gen 1999 anni
50.714
-0.019
-0.04%
1 gen 2000 anni
50.694
-0.019
-0.04%
1 gen 2001 anni
50.67
-0.024
-0.05%
1 gen 2002 anni
50.638
-0.032
-0.06%
1 gen 2003 anni
50.6
-0.038
-0.07%
1 gen 2004 anni
50.565
-0.036
-0.07%
1 gen 2005 anni
50.542
-0.023
-0.04%
1 gen 2006 anni
50.539
-0.003
-0.01%
1 gen 2007 anni
50.561
+0.021
0.04%
1 gen 2008 anni
50.601
+0.04
0.08%
1 gen 2009 anni
50.646
+0.045
0.09%
1 gen 2010 anni
50.679
+0.033
0.06%
1 gen 2011 anni
50.687
+0.009
0.02%
1 gen 2012 anni
50.668
-0.019
-0.04%
1 gen 2013 anni
50.628
-0.04
-0.08%
1 gen 2014 anni
50.578
-0.05
-0.1%
1 gen 2015 anni
50.532
-0.045
-0.09%
1 gen 2016 anni
50.502
-0.03
-0.06%
Classificazione dei paesi secondo i statistiche attuali per anni


Commenti: