29
/it/
it
AIzaSyAYiBZKx7MnpbEhh9jyipgxe19OcubqV5w
April 1, 2024
54144
Pacific island small states
PSS
false
2
1
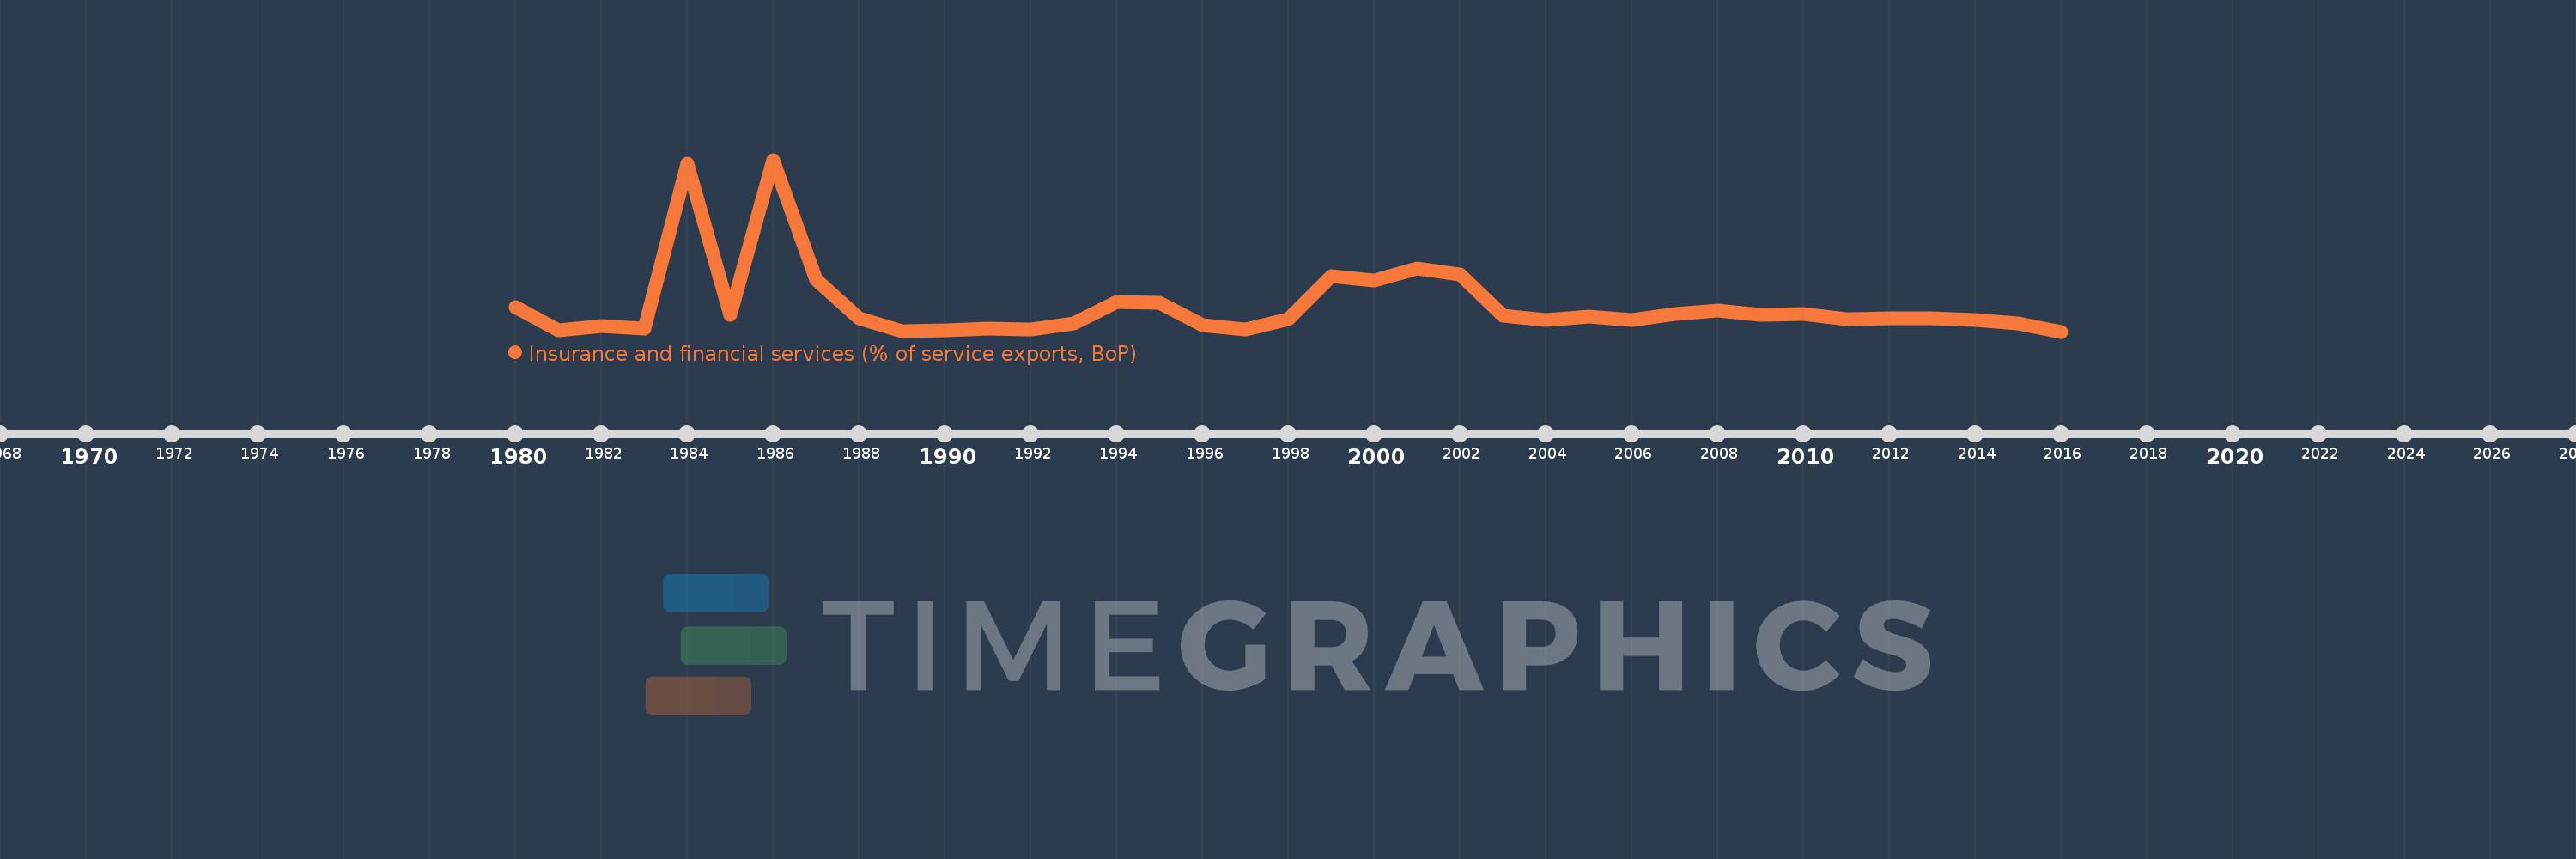
Insurance and financial services (% of service exports, BoP)
2016,2015,2014,2013,2012,2011,2010,2009,2008,2007,2006,2005,2004,2003,2002,2001,2000,1999,1998,1997,1996,1995,1994,1993,1992,1991,1990,1989,1988,1987,1986,1985,1984,1983,1982,1981,1980
Queste statistiche in altri paesi:
AfghanistanAlbaniaAlgeriaAngolaAntigua and BarbudaArab WorldArgentinaArmeniaArubaAustraliaAustriaAzerbaijanBahrainBangladeshBarbadosBelarusBelgiumBelizeBeninBermudaBhutanBoliviaBosnia and HerzegovinaBotswanaBrazilBrunei DarussalamBulgariaBurkina FasoBurundiCabo VerdeCambodiaCameroonCanadaCaribbean small statesCentral African RepublicCentral Europe and the BalticsChadChileChinaColombiaComorosCongo, Dem. Rep.Congo, Rep.Costa RicaCote d'IvoireCroatiaCuracaoCyprusCzech RepublicDenmarkDominicaDominican RepublicEarly-demographic dividendEast Asia & PacificEast Asia & Pacific (excluding high income)East Asia & Pacific (IDA & IBRD countries)EcuadorEgypt, Arab Rep.El SalvadorEritreaEstoniaEthiopiaEuro areaEurope & Central AsiaEurope & Central Asia (excluding high income)Europe & Central Asia (IDA & IBRD countries)European UnionFaroe IslandsFijiFinlandFragile and conflict affected situationsFranceFrench PolynesiaGabonGambia, TheGeorgiaGermanyGhanaGreeceGrenadaGuatemalaGuineaGuinea-BissauGuyanaHaitiHeavily indebted poor countries (HIPC)High incomeHondurasHong Kong SAR, ChinaHungaryIBRD onlyIcelandIDA & IBRD totalIDA onlyIDA totalIndiaIndonesiaIran, Islamic Rep.IraqIrelandIsraelItalyJamaicaJapanJordanKazakhstanKenyaKiribatiKorea, Rep.KosovoKuwaitKyrgyz RepublicLao PDRLate-demographic dividendLatin America & Caribbean Latin America & Caribbean (excluding high income)Latin America & the Caribbean (IDA & IBRD countries)LatviaLeast developed countries: UN classificationLebanonLesothoLiberiaLibyaLithuaniaLow & middle incomeLow incomeLower middle incomeLuxembourgMacao SAR, ChinaMacedonia, FYRMadagascarMalawiMalaysiaMaldivesMaliMaltaMauritaniaMauritiusMexicoMiddle East & North AfricaMiddle East & North Africa (excluding high income)Middle East & North Africa (IDA & IBRD countries)Middle incomeMoldovaMongoliaMontenegroMoroccoMozambiqueMyanmarNamibiaNepalNetherlandsNew CaledoniaNew ZealandNicaraguaNigerNigeriaNorth AmericaNorwayOECD membersOmanOther small statesPacific island small statesPakistanPalauPanamaPapua New GuineaParaguayPeruPhilippinesPolandPortugalPost-demographic dividendPre-demographic dividendQatarRomaniaRussian FederationRwandaSamoaSao Tome and PrincipeSaudi ArabiaSenegalSerbiaSeychellesSierra LeoneSingaporeSint Maarten (Dutch part)Slovak RepublicSloveniaSmall statesSolomon IslandsSouth AfricaSouth AsiaSouth Asia (IDA & IBRD)South SudanSpainSri LankaSt. Kitts and NevisSt. LuciaSt. Vincent and the GrenadinesSub-Saharan Africa Sub-Saharan Africa (excluding high income)Sub-Saharan Africa (IDA & IBRD countries)SudanSurinameSwazilandSwedenSwitzerlandSyrian Arab RepublicTajikistanTanzaniaThailandTimor-LesteTogoTongaTrinidad and TobagoTunisiaTurkeyTuvaluUgandaUkraineUnited KingdomUnited StatesUpper middle incomeUruguayVanuatuVenezuela, RBWest Bank and GazaWorldZambiaZimbabwe Linea del tempo:
Questa scala temporale mostra un grafico dal 1980 anno al 2016 anno. Pacific island small states. I dati fino ad 1979 anno non disponibili. Il numero di osservazioni attuali secondo i date: 37.
La fonte (nome):
Indicatori dello sviluppo mondiale
La fonte (organizzazione):
International Monetary Fund, Balance of Payments Statistics Yearbook and data files.
Categorie:
Economy & Growth, Private Sector, Trade
sono stati aggiornati
23 apr 2017 anni
Indicatori delle variazioni dei valori per anni
Minima:
0.645
1 gen 2016 anni
Massimo:
12.599
1 gen 1986 anni
Alla data di osservazione
Valore
Variazione assoluta
La variazione rispetto al valore precedente
1 gen 1980 anni
2.325
+2.325
0.0%
1 gen 1981 anni
0.708
-1.617
-69.54%
1 gen 1982 anni
1.048
+0.34
47.97%
1 gen 1983 anni
0.865
-0.184
-17.52%
1 gen 1984 anni
12.309
+11.445
1.32 Mille.%
1 gen 1985 anni
1.791
-10.518
-85.45%
1 gen 1986 anni
12.599
+10.807
603.28%
1 gen 1987 anni
4.233
-8.366
-66.4%
1 gen 1988 anni
1.574
-2.659
-62.82%
1 gen 1989 anni
0.649
-0.925
-58.79%
1 gen 1990 anni
0.747
+0.099
15.21%
1 gen 1991 anni
0.883
+0.136
18.19%
1 gen 1992 anni
0.787
-0.096
-10.92%
1 gen 1993 anni
1.195
+0.408
51.86%
1 gen 1994 anni
2.708
+1.513
126.68%
1 gen 1995 anni
2.651
-0.057
-2.1%
1 gen 1996 anni
1.065
-1.586
-59.84%
1 gen 1997 anni
0.803
-0.262
-24.62%
1 gen 1998 anni
1.521
+0.718
89.49%
1 gen 1999 anni
4.496
+2.976
195.67%
1 gen 2000 anni
4.193
-0.303
-6.75%
1 gen 2001 anni
5.02
+0.827
19.72%
1 gen 2002 anni
4.628
-0.392
-7.81%
1 gen 2003 anni
1.769
-2.859
-61.78%
1 gen 2004 anni
1.462
-0.307
-17.35%
1 gen 2005 anni
1.668
+0.207
14.13%
1 gen 2006 anni
1.48
-0.188
-11.26%
1 gen 2007 anni
1.877
+0.397
26.79%
1 gen 2008 anni
2.121
+0.244
13.02%
1 gen 2009 anni
1.782
-0.34
-16.02%
1 gen 2010 anni
1.85
+0.068
3.83%
1 gen 2011 anni
1.536
-0.314
-16.95%
1 gen 2012 anni
1.574
+0.038
2.48%
1 gen 2013 anni
1.558
-0.016
-1.04%
1 gen 2014 anni
1.469
-0.089
-5.71%
1 gen 2015 anni
1.202
-0.267
-18.19%
1 gen 2016 anni
0.645
-0.557
-46.33%
Classificazione dei paesi secondo i statistiche attuali per anni


Commenti: