29
/it/
it
AIzaSyAYiBZKx7MnpbEhh9jyipgxe19OcubqV5w
April 1, 2024
122290
Dominican Republic
DOM
true
2
1
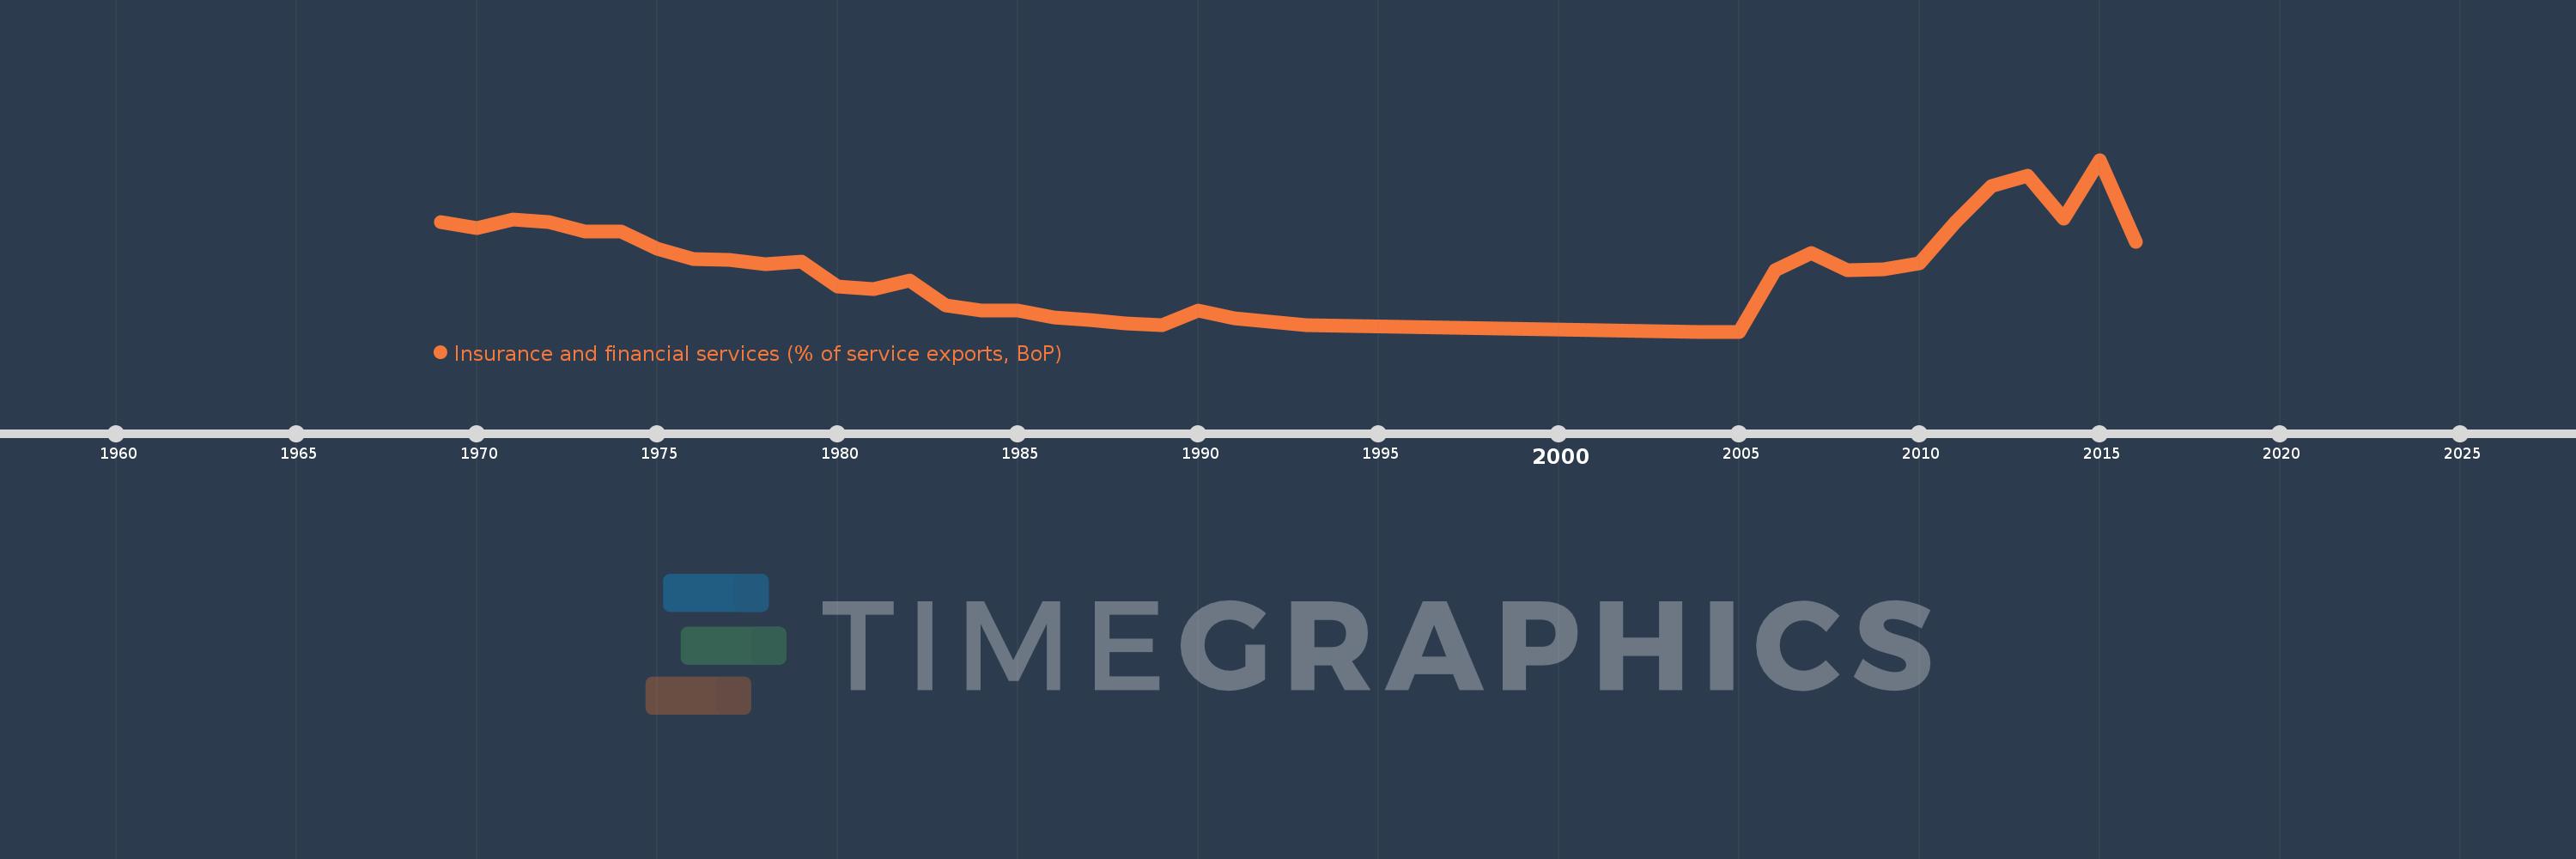
Insurance and financial services (% of service exports, BoP)
2016,2015,2014,2013,2012,2011,2010,2009,2008,2007,2006,2005,2004,1993,1992,1991,1990,1989,1988,1987,1986,1985,1984,1983,1982,1981,1980,1979,1978,1977,1976,1975,1974,1973,1972,1971,1970,1969
Queste statistiche in altri paesi:
AfghanistanAlbaniaAlgeriaAngolaAntigua and BarbudaArab WorldArgentinaArmeniaArubaAustraliaAustriaAzerbaijanBahrainBangladeshBarbadosBelarusBelgiumBelizeBeninBermudaBhutanBoliviaBosnia and HerzegovinaBotswanaBrazilBrunei DarussalamBulgariaBurkina FasoBurundiCabo VerdeCambodiaCameroonCanadaCaribbean small statesCentral African RepublicCentral Europe and the BalticsChadChileChinaColombiaComorosCongo, Dem. Rep.Congo, Rep.Costa RicaCote d'IvoireCroatiaCuracaoCyprusCzech RepublicDenmarkDominicaDominican RepublicEarly-demographic dividendEast Asia & PacificEast Asia & Pacific (excluding high income)East Asia & Pacific (IDA & IBRD countries)EcuadorEgypt, Arab Rep.El SalvadorEritreaEstoniaEthiopiaEuro areaEurope & Central AsiaEurope & Central Asia (excluding high income)Europe & Central Asia (IDA & IBRD countries)European UnionFaroe IslandsFijiFinlandFragile and conflict affected situationsFranceFrench PolynesiaGabonGambia, TheGeorgiaGermanyGhanaGreeceGrenadaGuatemalaGuineaGuinea-BissauGuyanaHaitiHeavily indebted poor countries (HIPC)High incomeHondurasHong Kong SAR, ChinaHungaryIBRD onlyIcelandIDA & IBRD totalIDA onlyIDA totalIndiaIndonesiaIran, Islamic Rep.IraqIrelandIsraelItalyJamaicaJapanJordanKazakhstanKenyaKiribatiKorea, Rep.KosovoKuwaitKyrgyz RepublicLao PDRLate-demographic dividendLatin America & Caribbean Latin America & Caribbean (excluding high income)Latin America & the Caribbean (IDA & IBRD countries)LatviaLeast developed countries: UN classificationLebanonLesothoLiberiaLibyaLithuaniaLow & middle incomeLow incomeLower middle incomeLuxembourgMacao SAR, ChinaMacedonia, FYRMadagascarMalawiMalaysiaMaldivesMaliMaltaMauritaniaMauritiusMexicoMiddle East & North AfricaMiddle East & North Africa (excluding high income)Middle East & North Africa (IDA & IBRD countries)Middle incomeMoldovaMongoliaMontenegroMoroccoMozambiqueMyanmarNamibiaNepalNetherlandsNew CaledoniaNew ZealandNicaraguaNigerNigeriaNorth AmericaNorwayOECD membersOmanOther small statesPacific island small statesPakistanPalauPanamaPapua New GuineaParaguayPeruPhilippinesPolandPortugalPost-demographic dividendPre-demographic dividendQatarRomaniaRussian FederationRwandaSamoaSao Tome and PrincipeSaudi ArabiaSenegalSerbiaSeychellesSierra LeoneSingaporeSint Maarten (Dutch part)Slovak RepublicSloveniaSmall statesSolomon IslandsSouth AfricaSouth AsiaSouth Asia (IDA & IBRD)South SudanSpainSri LankaSt. Kitts and NevisSt. LuciaSt. Vincent and the GrenadinesSub-Saharan Africa Sub-Saharan Africa (excluding high income)Sub-Saharan Africa (IDA & IBRD countries)SudanSurinameSwazilandSwedenSwitzerlandSyrian Arab RepublicTajikistanTanzaniaThailandTimor-LesteTogoTongaTrinidad and TobagoTunisiaTurkeyTuvaluUgandaUkraineUnited KingdomUnited StatesUpper middle incomeUruguayVanuatuVenezuela, RBWest Bank and GazaWorldZambiaZimbabwe Linea del tempo:
Questa scala temporale mostra un grafico dal 1969 anno al 2016 anno. Dominican Republic. I dati fino ad 1968 anno non disponibili. Il numero di osservazioni attuali secondo i date: 38.
La fonte (nome):
Indicatori dello sviluppo mondiale
La fonte (organizzazione):
International Monetary Fund, Balance of Payments Statistics Yearbook and data files.
Categorie:
Economy & Growth, Private Sector, Trade
sono stati aggiornati
23 apr 2017 anni
Indicatori delle variazioni dei valori per anni
Minima:
0.056
1 gen 2004 anni
Massimo:
1.711
1 gen 2015 anni
Alla data di osservazione
Valore
Variazione assoluta
La variazione rispetto al valore precedente
1 gen 1969 anni
1.111
+1.111
0.0%
1 gen 1970 anni
1.055
-0.056
-5.05%
1 gen 1971 anni
1.14
+0.084
8.01%
1 gen 1972 anni
1.111
-0.028
-2.49%
1 gen 1973 anni
1.024
-0.087
-7.87%
1 gen 1974 anni
1.021
-0.003
-0.26%
1 gen 1975 anni
0.857
-0.164
-16.11%
1 gen 1976 anni
0.757
-0.099
-11.58%
1 gen 1977 anni
0.751
-0.006
-0.81%
1 gen 1978 anni
0.709
-0.042
-5.62%
1 gen 1979 anni
0.734
+0.025
3.6%
1 gen 1980 anni
0.488
-0.246
-33.53%
1 gen 1981 anni
0.465
-0.023
-4.66%
1 gen 1982 anni
0.548
+0.083
17.82%
1 gen 1983 anni
0.307
-0.241
-43.94%
1 gen 1984 anni
0.256
-0.051
-16.64%
1 gen 1985 anni
0.259
+0.003
1.16%
1 gen 1986 anni
0.19
-0.069
-26.72%
1 gen 1987 anni
0.167
-0.023
-11.87%
1 gen 1988 anni
0.136
-0.031
-18.67%
1 gen 1989 anni
0.119
-0.017
-12.3%
1 gen 1990 anni
0.257
+0.138
115.59%
1 gen 1991 anni
0.186
-0.071
-27.77%
1 gen 1992 anni
0.152
-0.034
-18.34%
1 gen 1993 anni
0.116
-0.035
-23.32%
1 gen 2004 anni
0.056
-0.06
-51.79%
1 gen 2005 anni
0.056
+0.0
0.56%
1 gen 2006 anni
0.65
+0.594
1.05 Mille.%
1 gen 2007 anni
0.81
+0.16
24.53%
1 gen 2008 anni
0.65
-0.16
-19.79%
1 gen 2009 anni
0.657
+0.008
1.19%
1 gen 2010 anni
0.71
+0.053
8.07%
1 gen 2011 anni
1.107
+0.396
55.78%
1 gen 2012 anni
1.458
+0.351
31.76%
1 gen 2013 anni
1.557
+0.099
6.78%
1 gen 2014 anni
1.146
-0.411
-26.41%
1 gen 2015 anni
1.711
+0.565
49.32%
1 gen 2016 anni
0.917
-0.794
-46.42%
Classificazione dei paesi secondo i statistiche attuali per anni


Commenti: