29
/it/
it
AIzaSyAYiBZKx7MnpbEhh9jyipgxe19OcubqV5w
April 1, 2024
53927
Pacific island small states
PSS
false
2
1
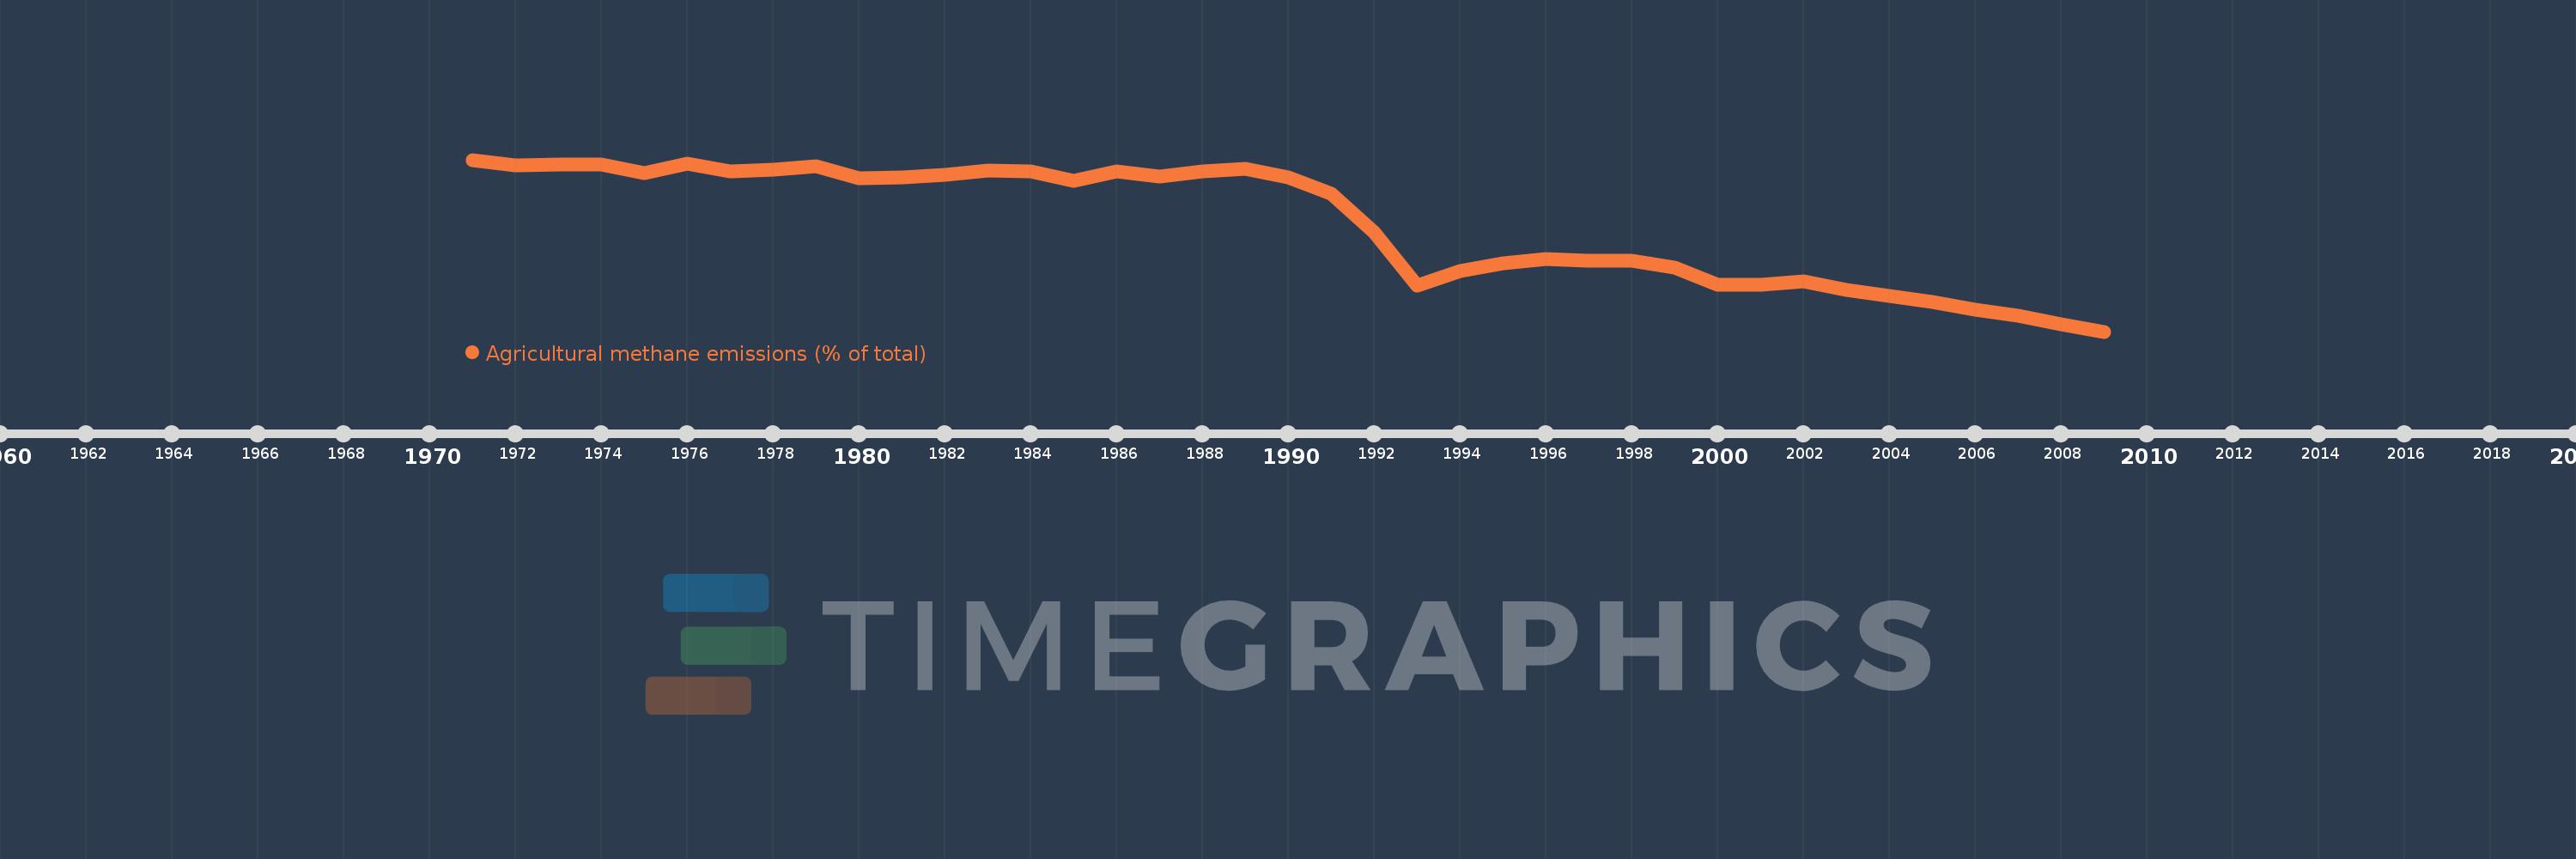
Agricultural methane emissions (% of total)
2009,2008,2007,2006,2005,2004,2003,2002,2001,2000,1999,1998,1997,1996,1995,1994,1993,1992,1991,1990,1989,1988,1987,1986,1985,1984,1983,1982,1981,1980,1979,1978,1977,1976,1975,1974,1973,1972,1971
Queste statistiche in altri paesi:
AfghanistanAlbaniaAlgeriaAmerican SamoaAngolaAntigua and BarbudaArab WorldArgentinaArmeniaArubaAustraliaAustriaAzerbaijanBahamas, TheBahrainBangladeshBarbadosBelarusBelgiumBelizeBeninBermudaBhutanBoliviaBosnia and HerzegovinaBotswanaBrazilBritish Virgin IslandsBrunei DarussalamBulgariaBurkina FasoBurundiCabo VerdeCambodiaCameroonCanadaCaribbean small statesCayman IslandsCentral African RepublicCentral Europe and the BalticsChadChileChinaColombiaComorosCongo, Dem. Rep.Congo, Rep.Costa RicaCote d'IvoireCroatiaCubaCyprusCzech RepublicDenmarkDjiboutiDominicaDominican RepublicEarly-demographic dividendEast Asia & PacificEast Asia & Pacific (excluding high income)East Asia & Pacific (IDA & IBRD countries)EcuadorEgypt, Arab Rep.El SalvadorEquatorial GuineaEritreaEstoniaEthiopiaEuro areaEurope & Central AsiaEurope & Central Asia (excluding high income)Europe & Central Asia (IDA & IBRD countries)European UnionFaroe IslandsFijiFinlandFragile and conflict affected situationsFranceFrench PolynesiaGabonGambia, TheGeorgiaGermanyGhanaGibraltarGreeceGreenlandGrenadaGuamGuatemalaGuineaGuinea-BissauGuyanaHaitiHeavily indebted poor countries (HIPC)High incomeHondurasHong Kong SAR, ChinaHungaryIBRD onlyIcelandIDA & IBRD totalIDA blendIDA onlyIDA totalIndiaIndonesiaIran, Islamic Rep.IraqIrelandIsraelItalyJamaicaJapanJordanKazakhstanKenyaKiribatiKorea, Dem. People’s Rep.Korea, Rep.KuwaitKyrgyz RepublicLao PDRLate-demographic dividendLatin America & Caribbean Latin America & Caribbean (excluding high income)Latin America & the Caribbean (IDA & IBRD countries)LatviaLeast developed countries: UN classificationLebanonLesothoLiberiaLibyaLithuaniaLow & middle incomeLow incomeLower middle incomeLuxembourgMacao SAR, ChinaMacedonia, FYRMadagascarMalawiMalaysiaMaldivesMaliMaltaMarshall IslandsMauritaniaMauritiusMexicoMicronesia, Fed. Sts.Middle East & North AfricaMiddle East & North Africa (excluding high income)Middle East & North Africa (IDA & IBRD countries)Middle incomeMoldovaMongoliaMoroccoMozambiqueMyanmarNamibiaNauruNepalNetherlandsNew CaledoniaNew ZealandNicaraguaNigerNigeriaNorth AmericaNorthern Mariana IslandsNorwayOECD membersOmanOther small statesPacific island small statesPakistanPalauPanamaPapua New GuineaParaguayPeruPhilippinesPolandPortugalPost-demographic dividendPre-demographic dividendPuerto RicoQatarRomaniaRussian FederationRwandaSamoaSao Tome and PrincipeSaudi ArabiaSenegalSerbiaSeychellesSierra LeoneSingaporeSlovak RepublicSloveniaSmall statesSolomon IslandsSomaliaSouth AfricaSouth AsiaSouth Asia (IDA & IBRD)SpainSri LankaSt. Kitts and NevisSt. LuciaSt. Vincent and the GrenadinesSub-Saharan Africa Sub-Saharan Africa (excluding high income)Sub-Saharan Africa (IDA & IBRD countries)SudanSurinameSwazilandSwedenSwitzerlandSyrian Arab RepublicTajikistanTanzaniaThailandTimor-LesteTogoTongaTrinidad and TobagoTunisiaTurkeyTurkmenistanTurks and Caicos IslandsTuvaluUgandaUkraineUnited Arab EmiratesUnited KingdomUnited StatesUpper middle incomeUruguayUzbekistanVanuatuVenezuela, RBVietnamVirgin Islands (U.S.)WorldYemen, Rep.ZambiaZimbabwe Linea del tempo:
Questa scala temporale mostra un grafico dal 1971 anno al 2009 anno. Pacific island small states. I dati fino ad 1970 anno non disponibili. Il numero di osservazioni attuali secondo i date: 39.
La fonte (nome):
Indicatori dello sviluppo mondiale
La fonte (organizzazione):
World Bank staff estimates from original source: European Commission, Joint Research Centre (JRC)/Netherlands Environmental Assessment Agency (PBL). Emission Database for Global Atmospheric Research (EDGAR): http://edgar.jrc.ec.europa.eu/.
Categorie:
Agriculture & Rural Development, Environment
sono stati aggiornati
23 apr 2017 anni
Indicatori delle variazioni dei valori per anni
Minima:
87.518
1 gen 2009 anni
Massimo:
93.626
1 gen 1971 anni
Alla data di osservazione
Valore
Variazione assoluta
La variazione rispetto al valore precedente
1 gen 1971 anni
93.626
+93.626
0.0%
1 gen 1972 anni
93.441
-0.186
-0.2%
1 gen 1973 anni
93.451
+0.011
0.01%
1 gen 1974 anni
93.447
-0.004
0.0%
1 gen 1975 anni
93.142
-0.305
-0.33%
1 gen 1976 anni
93.476
+0.334
0.36%
1 gen 1977 anni
93.225
-0.252
-0.27%
1 gen 1978 anni
93.271
+0.046
0.05%
1 gen 1979 anni
93.412
+0.141
0.15%
1 gen 1980 anni
92.982
-0.43
-0.46%
1 gen 1981 anni
92.992
+0.01
0.01%
1 gen 1982 anni
93.092
+0.1
0.11%
1 gen 1983 anni
93.236
+0.144
0.15%
1 gen 1984 anni
93.218
-0.018
-0.02%
1 gen 1985 anni
92.873
-0.345
-0.37%
1 gen 1986 anni
93.209
+0.336
0.36%
1 gen 1987 anni
93.022
-0.187
-0.2%
1 gen 1988 anni
93.21
+0.188
0.2%
1 gen 1989 anni
93.294
+0.084
0.09%
1 gen 1990 anni
92.995
-0.299
-0.32%
1 gen 1991 anni
92.434
-0.561
-0.6%
1 gen 1992 anni
91.04
-1.394
-1.51%
1 gen 1993 anni
89.159
-1.881
-2.07%
1 gen 1994 anni
89.673
+0.514
0.58%
1 gen 1995 anni
89.953
+0.28
0.31%
1 gen 1996 anni
90.107
+0.155
0.17%
1 gen 1997 anni
90.051
-0.056
-0.06%
1 gen 1998 anni
90.037
-0.015
-0.02%
1 gen 1999 anni
89.786
-0.25
-0.28%
1 gen 2000 anni
89.169
-0.618
-0.69%
1 gen 2001 anni
89.195
+0.027
0.03%
1 gen 2002 anni
89.307
+0.112
0.13%
1 gen 2003 anni
88.991
-0.316
-0.35%
1 gen 2004 anni
88.798
-0.193
-0.22%
1 gen 2005 anni
88.569
-0.229
-0.26%
1 gen 2006 anni
88.307
-0.263
-0.3%
1 gen 2007 anni
88.075
-0.231
-0.26%
1 gen 2008 anni
87.78
-0.296
-0.34%
1 gen 2009 anni
87.518
-0.261
-0.3%
Classificazione dei paesi secondo i statistiche attuali per anni


Commenti: