29
/it/
it
AIzaSyAYiBZKx7MnpbEhh9jyipgxe19OcubqV5w
April 1, 2024
204930
Namibia
NAM
true
2
1
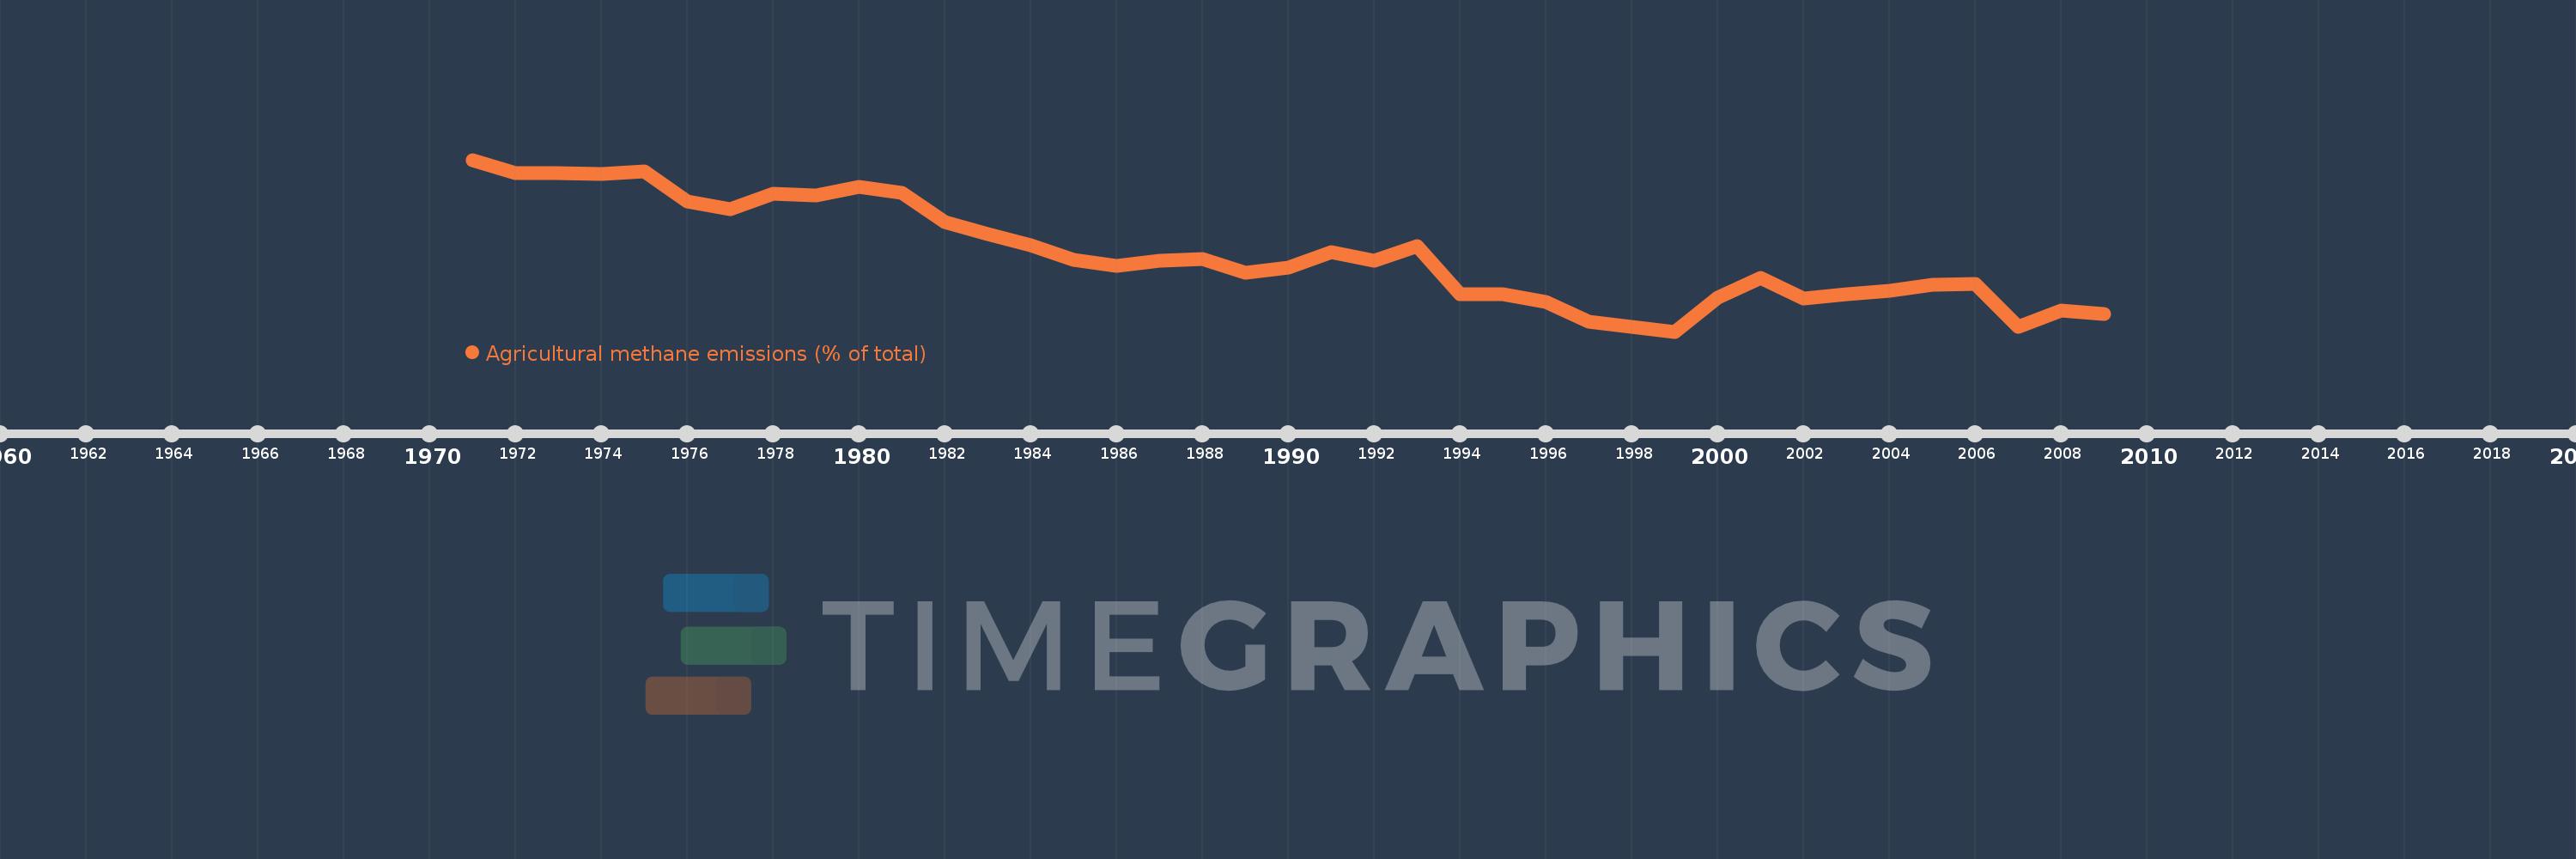
Agricultural methane emissions (% of total)
2009,2008,2007,2006,2005,2004,2003,2002,2001,2000,1999,1998,1997,1996,1995,1994,1993,1992,1991,1990,1989,1988,1987,1986,1985,1984,1983,1982,1981,1980,1979,1978,1977,1976,1975,1974,1973,1972,1971
Queste statistiche in altri paesi:
AfghanistanAlbaniaAlgeriaAmerican SamoaAngolaAntigua and BarbudaArab WorldArgentinaArmeniaArubaAustraliaAustriaAzerbaijanBahamas, TheBahrainBangladeshBarbadosBelarusBelgiumBelizeBeninBermudaBhutanBoliviaBosnia and HerzegovinaBotswanaBrazilBritish Virgin IslandsBrunei DarussalamBulgariaBurkina FasoBurundiCabo VerdeCambodiaCameroonCanadaCaribbean small statesCayman IslandsCentral African RepublicCentral Europe and the BalticsChadChileChinaColombiaComorosCongo, Dem. Rep.Congo, Rep.Costa RicaCote d'IvoireCroatiaCubaCyprusCzech RepublicDenmarkDjiboutiDominicaDominican RepublicEarly-demographic dividendEast Asia & PacificEast Asia & Pacific (excluding high income)East Asia & Pacific (IDA & IBRD countries)EcuadorEgypt, Arab Rep.El SalvadorEquatorial GuineaEritreaEstoniaEthiopiaEuro areaEurope & Central AsiaEurope & Central Asia (excluding high income)Europe & Central Asia (IDA & IBRD countries)European UnionFaroe IslandsFijiFinlandFragile and conflict affected situationsFranceFrench PolynesiaGabonGambia, TheGeorgiaGermanyGhanaGibraltarGreeceGreenlandGrenadaGuamGuatemalaGuineaGuinea-BissauGuyanaHaitiHeavily indebted poor countries (HIPC)High incomeHondurasHong Kong SAR, ChinaHungaryIBRD onlyIcelandIDA & IBRD totalIDA blendIDA onlyIDA totalIndiaIndonesiaIran, Islamic Rep.IraqIrelandIsraelItalyJamaicaJapanJordanKazakhstanKenyaKiribatiKorea, Dem. People’s Rep.Korea, Rep.KuwaitKyrgyz RepublicLao PDRLate-demographic dividendLatin America & Caribbean Latin America & Caribbean (excluding high income)Latin America & the Caribbean (IDA & IBRD countries)LatviaLeast developed countries: UN classificationLebanonLesothoLiberiaLibyaLithuaniaLow & middle incomeLow incomeLower middle incomeLuxembourgMacao SAR, ChinaMacedonia, FYRMadagascarMalawiMalaysiaMaldivesMaliMaltaMarshall IslandsMauritaniaMauritiusMexicoMicronesia, Fed. Sts.Middle East & North AfricaMiddle East & North Africa (excluding high income)Middle East & North Africa (IDA & IBRD countries)Middle incomeMoldovaMongoliaMoroccoMozambiqueMyanmarNamibiaNauruNepalNetherlandsNew CaledoniaNew ZealandNicaraguaNigerNigeriaNorth AmericaNorthern Mariana IslandsNorwayOECD membersOmanOther small statesPacific island small statesPakistanPalauPanamaPapua New GuineaParaguayPeruPhilippinesPolandPortugalPost-demographic dividendPre-demographic dividendPuerto RicoQatarRomaniaRussian FederationRwandaSamoaSao Tome and PrincipeSaudi ArabiaSenegalSerbiaSeychellesSierra LeoneSingaporeSlovak RepublicSloveniaSmall statesSolomon IslandsSomaliaSouth AfricaSouth AsiaSouth Asia (IDA & IBRD)SpainSri LankaSt. Kitts and NevisSt. LuciaSt. Vincent and the GrenadinesSub-Saharan Africa Sub-Saharan Africa (excluding high income)Sub-Saharan Africa (IDA & IBRD countries)SudanSurinameSwazilandSwedenSwitzerlandSyrian Arab RepublicTajikistanTanzaniaThailandTimor-LesteTogoTongaTrinidad and TobagoTunisiaTurkeyTurkmenistanTurks and Caicos IslandsTuvaluUgandaUkraineUnited Arab EmiratesUnited KingdomUnited StatesUpper middle incomeUruguayUzbekistanVanuatuVenezuela, RBVietnamVirgin Islands (U.S.)WorldYemen, Rep.ZambiaZimbabwe Linea del tempo:
Questa scala temporale mostra un grafico dal 1971 anno al 2009 anno. Namibia. I dati fino ad 1970 anno non disponibili. Il numero di osservazioni attuali secondo i date: 39.
La fonte (nome):
Indicatori dello sviluppo mondiale
La fonte (organizzazione):
World Bank staff estimates from original source: European Commission, Joint Research Centre (JRC)/Netherlands Environmental Assessment Agency (PBL). Emission Database for Global Atmospheric Research (EDGAR): http://edgar.jrc.ec.europa.eu/.
Categorie:
Agriculture & Rural Development, Environment
sono stati aggiornati
23 apr 2017 anni
Indicatori delle variazioni dei valori per anni
Minima:
91.395
1 gen 1999 anni
Massimo:
97.311
1 gen 1971 anni
Alla data di osservazione
Valore
Variazione assoluta
La variazione rispetto al valore precedente
1 gen 1971 anni
97.311
+97.311
0.0%
1 gen 1972 anni
96.852
-0.459
-0.47%
1 gen 1973 anni
96.838
-0.014
-0.01%
1 gen 1974 anni
96.814
-0.024
-0.02%
1 gen 1975 anni
96.902
+0.088
0.09%
1 gen 1976 anni
95.888
-1.014
-1.05%
1 gen 1977 anni
95.618
-0.27
-0.28%
1 gen 1978 anni
96.142
+0.525
0.55%
1 gen 1979 anni
96.076
-0.066
-0.07%
1 gen 1980 anni
96.368
+0.291
0.3%
1 gen 1981 anni
96.169
-0.199
-0.21%
1 gen 1982 anni
95.179
-0.99
-1.03%
1 gen 1983 anni
94.741
-0.438
-0.46%
1 gen 1984 anni
94.358
-0.383
-0.4%
1 gen 1985 anni
93.852
-0.506
-0.54%
1 gen 1986 anni
93.667
-0.185
-0.2%
1 gen 1987 anni
93.83
+0.163
0.17%
1 gen 1988 anni
93.903
+0.073
0.08%
1 gen 1989 anni
93.431
-0.473
-0.5%
1 gen 1990 anni
93.607
+0.176
0.19%
1 gen 1991 anni
94.12
+0.513
0.55%
1 gen 1992 anni
93.84
-0.28
-0.3%
1 gen 1993 anni
94.352
+0.512
0.55%
1 gen 1994 anni
92.683
-1.669
-1.77%
1 gen 1995 anni
92.669
-0.014
-0.02%
1 gen 1996 anni
92.404
-0.265
-0.29%
1 gen 1997 anni
91.74
-0.663
-0.72%
1 gen 1998 anni
91.564
-0.176
-0.19%
1 gen 1999 anni
91.395
-0.169
-0.18%
1 gen 2000 anni
92.56
+1.165
1.27%
1 gen 2001 anni
93.236
+0.676
0.73%
1 gen 2002 anni
92.527
-0.708
-0.76%
1 gen 2003 anni
92.668
+0.141
0.15%
1 gen 2004 anni
92.79
+0.122
0.13%
1 gen 2005 anni
92.996
+0.206
0.22%
1 gen 2006 anni
93.044
+0.049
0.05%
1 gen 2007 anni
91.543
-1.501
-1.61%
1 gen 2008 anni
92.125
+0.581
0.64%
1 gen 2009 anni
91.998
-0.126
-0.14%
Classificazione dei paesi secondo i statistiche attuali per anni


Commenti: