29
/it/
it
AIzaSyAYiBZKx7MnpbEhh9jyipgxe19OcubqV5w
April 1, 2024
53134
OECD members
OED
false
2
1
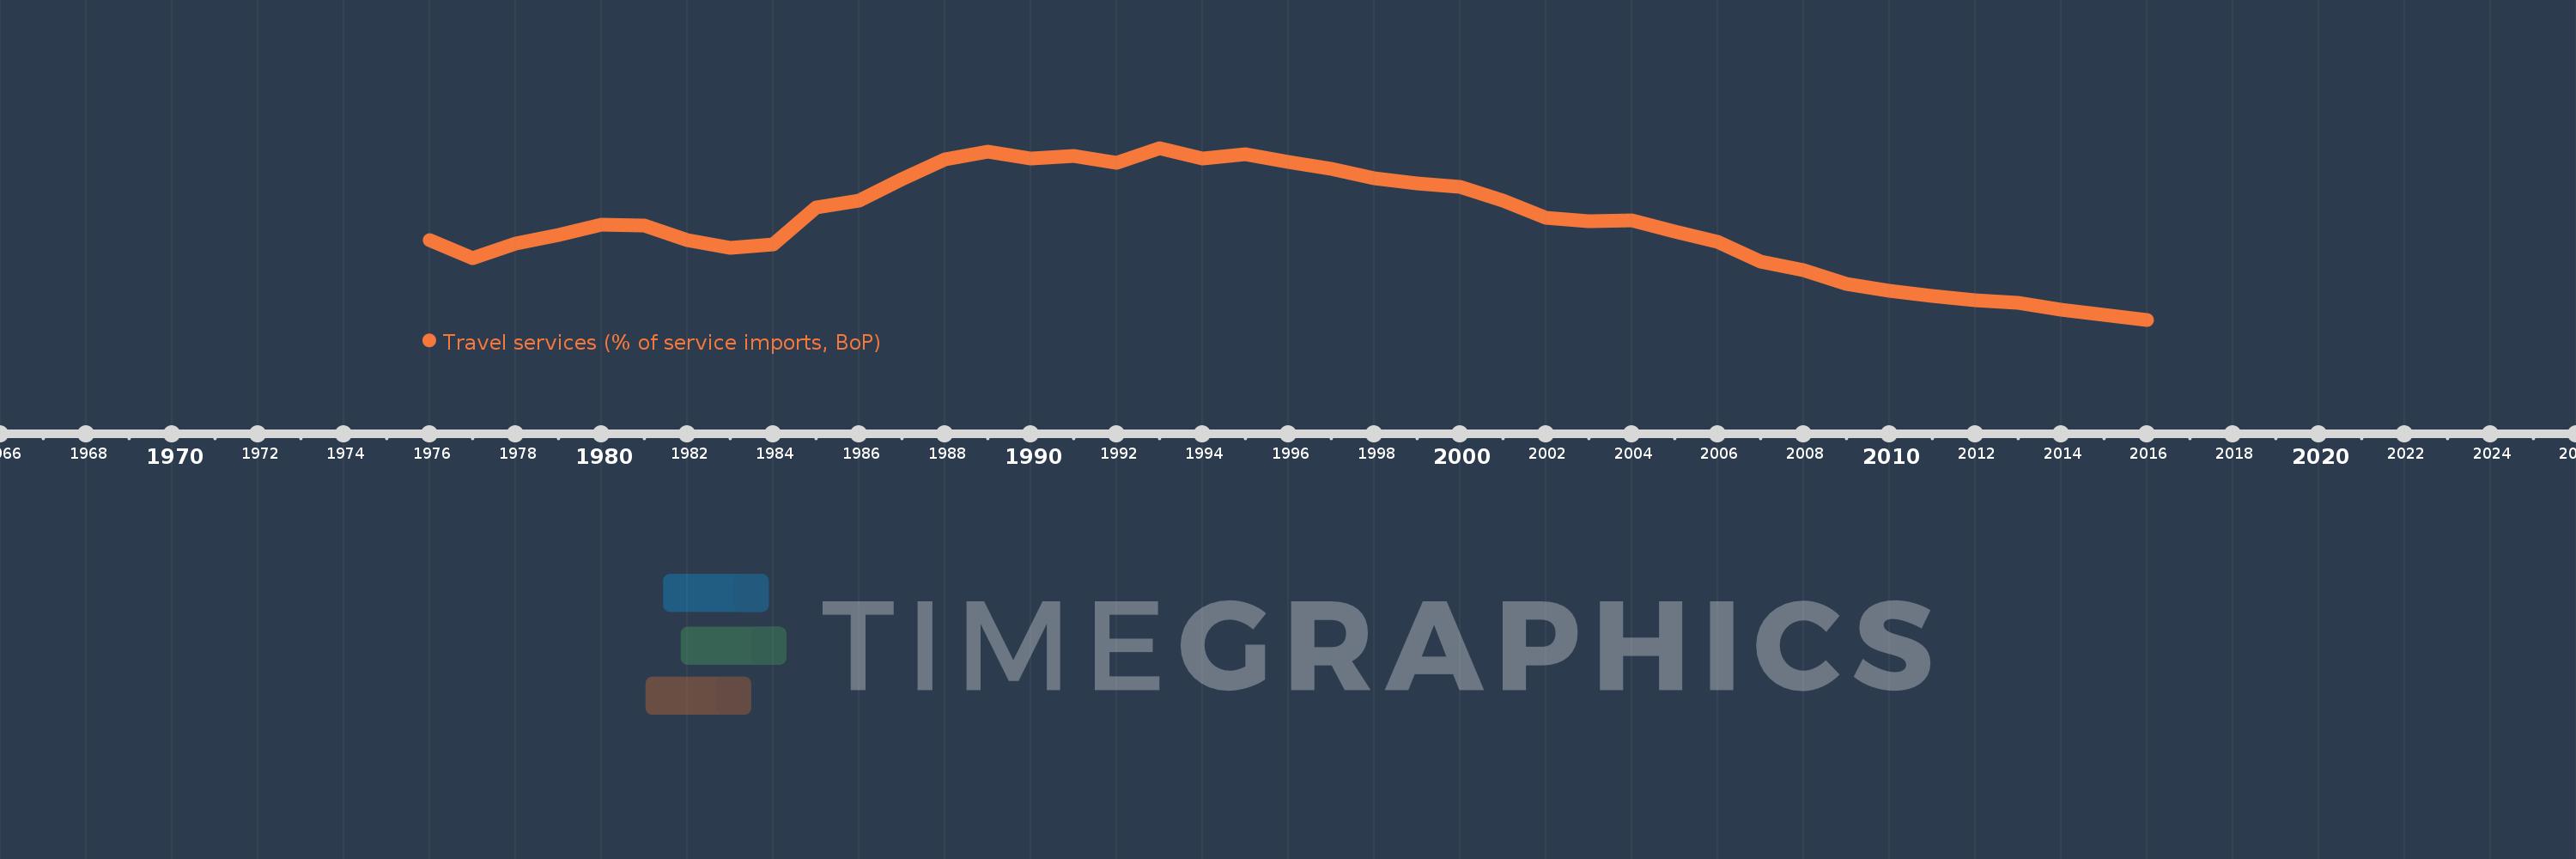
Travel services (% of service imports, BoP)
2016,2015,2014,2013,2012,2011,2010,2009,2008,2007,2006,2005,2004,2003,2002,2001,2000,1999,1998,1997,1996,1995,1994,1993,1992,1991,1990,1989,1988,1987,1986,1985,1984,1983,1982,1981,1980,1979,1978,1977,1976
Queste statistiche in altri paesi:
AfghanistanAlbaniaAlgeriaAngolaAntigua and BarbudaArab WorldArgentinaArmeniaArubaAustraliaAustriaAzerbaijanBahamas, TheBahrainBangladeshBarbadosBelarusBelgiumBelizeBeninBermudaBhutanBoliviaBosnia and HerzegovinaBotswanaBrazilBrunei DarussalamBulgariaBurkina FasoBurundiCabo VerdeCambodiaCameroonCanadaCaribbean small statesCentral African RepublicCentral Europe and the BalticsChadChileChinaColombiaComorosCongo, Dem. Rep.Congo, Rep.Costa RicaCote d'IvoireCroatiaCuracaoCyprusCzech RepublicDenmarkDjiboutiDominicaDominican RepublicEarly-demographic dividendEast Asia & PacificEast Asia & Pacific (excluding high income)East Asia & Pacific (IDA & IBRD countries)EcuadorEgypt, Arab Rep.El SalvadorEritreaEstoniaEthiopiaEuro areaEurope & Central AsiaEurope & Central Asia (excluding high income)Europe & Central Asia (IDA & IBRD countries)European UnionFaroe IslandsFijiFinlandFragile and conflict affected situationsFranceFrench PolynesiaGabonGambia, TheGeorgiaGermanyGhanaGreeceGrenadaGuatemalaGuineaGuinea-BissauGuyanaHaitiHeavily indebted poor countries (HIPC)High incomeHondurasHong Kong SAR, ChinaHungaryIBRD onlyIcelandIDA & IBRD totalIDA onlyIDA totalIndiaIndonesiaIran, Islamic Rep.IraqIrelandIsraelItalyJamaicaJapanJordanKazakhstanKenyaKiribatiKorea, Rep.KosovoKuwaitKyrgyz RepublicLao PDRLate-demographic dividendLatin America & Caribbean Latin America & Caribbean (excluding high income)Latin America & the Caribbean (IDA & IBRD countries)LatviaLeast developed countries: UN classificationLebanonLesothoLiberiaLibyaLithuaniaLow & middle incomeLow incomeLower middle incomeLuxembourgMacao SAR, ChinaMacedonia, FYRMadagascarMalawiMalaysiaMaldivesMaliMaltaMarshall IslandsMauritaniaMauritiusMexicoMicronesia, Fed. Sts.Middle East & North AfricaMiddle East & North Africa (excluding high income)Middle East & North Africa (IDA & IBRD countries)Middle incomeMoldovaMongoliaMontenegroMoroccoMozambiqueMyanmarNamibiaNepalNetherlandsNew CaledoniaNew ZealandNicaraguaNigerNigeriaNorth AmericaNorwayOECD membersOmanOther small statesPacific island small statesPakistanPalauPanamaPapua New GuineaParaguayPeruPhilippinesPolandPortugalPost-demographic dividendPre-demographic dividendQatarRomaniaRussian FederationRwandaSamoaSao Tome and PrincipeSaudi ArabiaSenegalSerbiaSeychellesSierra LeoneSingaporeSint Maarten (Dutch part)Slovak RepublicSloveniaSmall statesSolomon IslandsSouth AfricaSouth AsiaSouth Asia (IDA & IBRD)South SudanSpainSri LankaSt. Kitts and NevisSt. LuciaSt. Vincent and the GrenadinesSub-Saharan Africa Sub-Saharan Africa (excluding high income)Sub-Saharan Africa (IDA & IBRD countries)SudanSurinameSwazilandSwedenSwitzerlandSyrian Arab RepublicTajikistanTanzaniaThailandTimor-LesteTogoTongaTrinidad and TobagoTunisiaTurkeyTuvaluUgandaUkraineUnited KingdomUnited StatesUpper middle incomeUruguayVanuatuVenezuela, RBWest Bank and GazaWorldYemen, Rep.ZambiaZimbabwe Linea del tempo:
Questa scala temporale mostra un grafico dal 1976 anno al 2016 anno. OECD members. I dati fino ad 1975 anno non disponibili. Il numero di osservazioni attuali secondo i date: 41.
La fonte (nome):
Indicatori dello sviluppo mondiale
La fonte (organizzazione):
International Monetary Fund, Balance of Payments Statistics Yearbook and data files.
Categorie:
Economy & Growth, Trade
sono stati aggiornati
23 apr 2017 anni
Indicatori delle variazioni dei valori per anni
Minima:
20.717
1 gen 2016 anni
Massimo:
33.58
1 gen 1993 anni
Alla data di osservazione
Valore
Variazione assoluta
La variazione rispetto al valore precedente
1 gen 1976 anni
26.711
+26.711
0.0%
1 gen 1977 anni
25.345
-1.365
-5.11%
1 gen 1978 anni
26.409
+1.063
4.2%
1 gen 1979 anni
27.057
+0.649
2.46%
1 gen 1980 anni
27.855
+0.798
2.95%
1 gen 1981 anni
27.799
-0.057
-0.2%
1 gen 1982 anni
26.69
-1.109
-3.99%
1 gen 1983 anni
26.085
-0.605
-2.27%
1 gen 1984 anni
26.36
+0.275
1.05%
1 gen 1985 anni
29.14
+2.78
10.55%
1 gen 1986 anni
29.624
+0.484
1.66%
1 gen 1987 anni
31.271
+1.647
5.56%
1 gen 1988 anni
32.703
+1.432
4.58%
1 gen 1989 anni
33.31
+0.607
1.86%
1 gen 1990 anni
32.802
-0.508
-1.53%
1 gen 1991 anni
32.988
+0.186
0.57%
1 gen 1992 anni
32.485
-0.503
-1.53%
1 gen 1993 anni
33.58
+1.096
3.37%
1 gen 1994 anni
32.803
-0.778
-2.32%
1 gen 1995 anni
33.136
+0.333
1.02%
1 gen 1996 anni
32.529
-0.607
-1.83%
1 gen 1997 anni
32.048
-0.48
-1.48%
1 gen 1998 anni
31.31
-0.738
-2.3%
1 gen 1999 anni
30.899
-0.412
-1.32%
1 gen 2000 anni
30.675
-0.224
-0.72%
1 gen 2001 anni
29.624
-1.051
-3.43%
1 gen 2002 anni
28.328
-1.296
-4.37%
1 gen 2003 anni
28.077
-0.251
-0.88%
1 gen 2004 anni
28.136
+0.059
0.21%
1 gen 2005 anni
27.304
-0.832
-2.96%
1 gen 2006 anni
26.53
-0.775
-2.84%
1 gen 2007 anni
25.057
-1.473
-5.55%
1 gen 2008 anni
24.435
-0.622
-2.48%
1 gen 2009 anni
23.412
-1.022
-4.18%
1 gen 2010 anni
22.895
-0.518
-2.21%
1 gen 2011 anni
22.508
-0.387
-1.69%
1 gen 2012 anni
22.198
-0.31
-1.38%
1 gen 2013 anni
21.966
-0.232
-1.05%
1 gen 2014 anni
21.439
-0.527
-2.4%
1 gen 2015 anni
21.1
-0.339
-1.58%
1 gen 2016 anni
20.717
-0.383
-1.82%
Classificazione dei paesi secondo i statistiche attuali per anni


Commenti: