29
/it/
it
AIzaSyAYiBZKx7MnpbEhh9jyipgxe19OcubqV5w
April 1, 2024
161096
Israel
ISR
true
2
1
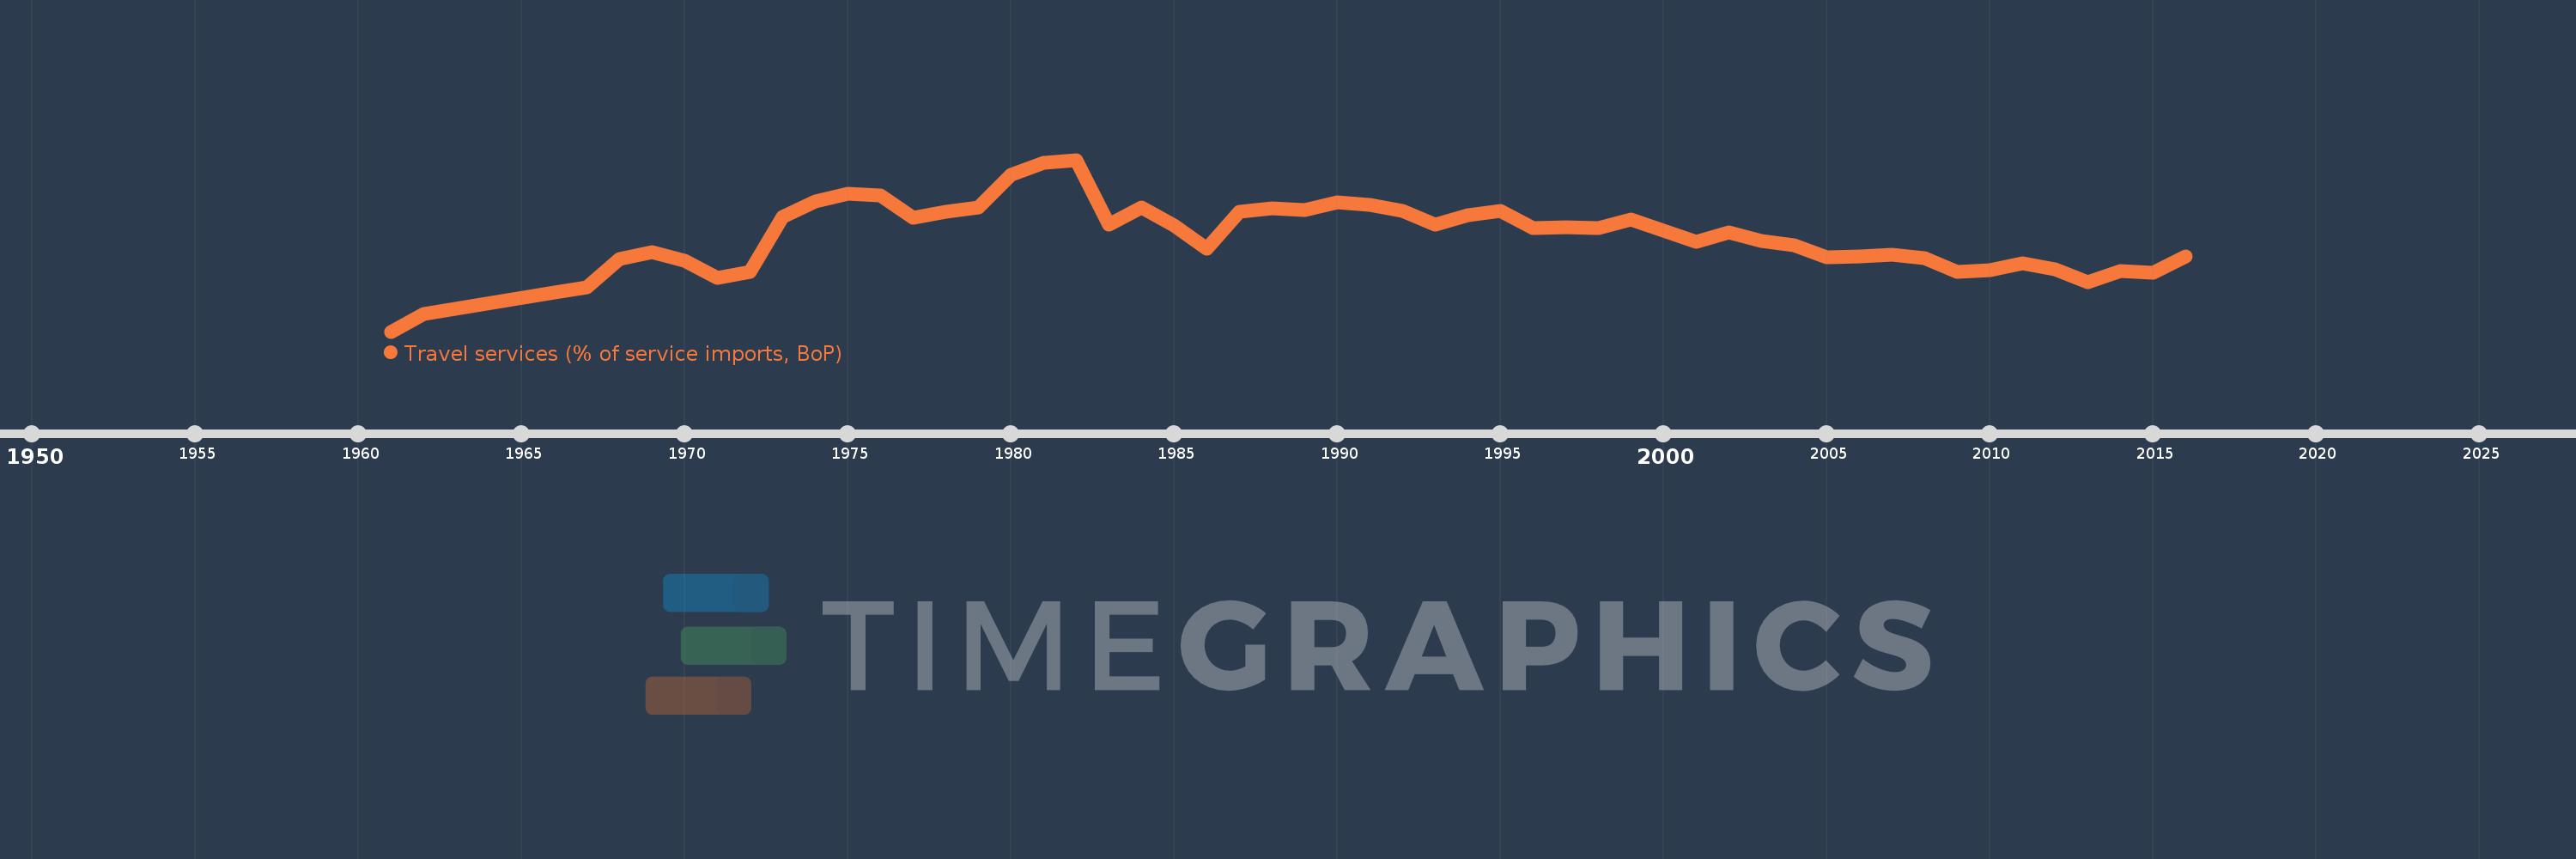
Travel services (% of service imports, BoP)
2016,2015,2014,2013,2012,2011,2010,2009,2008,2007,2006,2005,2004,2003,2002,2001,2000,1999,1998,1997,1996,1995,1994,1993,1992,1991,1990,1989,1988,1987,1986,1985,1984,1983,1982,1981,1980,1979,1978,1977,1976,1975,1974,1973,1972,1971,1970,1969,1968,1967,1966,1962,1961
Queste statistiche in altri paesi:
AfghanistanAlbaniaAlgeriaAngolaAntigua and BarbudaArab WorldArgentinaArmeniaArubaAustraliaAustriaAzerbaijanBahamas, TheBahrainBangladeshBarbadosBelarusBelgiumBelizeBeninBermudaBhutanBoliviaBosnia and HerzegovinaBotswanaBrazilBrunei DarussalamBulgariaBurkina FasoBurundiCabo VerdeCambodiaCameroonCanadaCaribbean small statesCentral African RepublicCentral Europe and the BalticsChadChileChinaColombiaComorosCongo, Dem. Rep.Congo, Rep.Costa RicaCote d'IvoireCroatiaCuracaoCyprusCzech RepublicDenmarkDjiboutiDominicaDominican RepublicEarly-demographic dividendEast Asia & PacificEast Asia & Pacific (excluding high income)East Asia & Pacific (IDA & IBRD countries)EcuadorEgypt, Arab Rep.El SalvadorEritreaEstoniaEthiopiaEuro areaEurope & Central AsiaEurope & Central Asia (excluding high income)Europe & Central Asia (IDA & IBRD countries)European UnionFaroe IslandsFijiFinlandFragile and conflict affected situationsFranceFrench PolynesiaGabonGambia, TheGeorgiaGermanyGhanaGreeceGrenadaGuatemalaGuineaGuinea-BissauGuyanaHaitiHeavily indebted poor countries (HIPC)High incomeHondurasHong Kong SAR, ChinaHungaryIBRD onlyIcelandIDA & IBRD totalIDA onlyIDA totalIndiaIndonesiaIran, Islamic Rep.IraqIrelandIsraelItalyJamaicaJapanJordanKazakhstanKenyaKiribatiKorea, Rep.KosovoKuwaitKyrgyz RepublicLao PDRLate-demographic dividendLatin America & Caribbean Latin America & Caribbean (excluding high income)Latin America & the Caribbean (IDA & IBRD countries)LatviaLeast developed countries: UN classificationLebanonLesothoLiberiaLibyaLithuaniaLow & middle incomeLow incomeLower middle incomeLuxembourgMacao SAR, ChinaMacedonia, FYRMadagascarMalawiMalaysiaMaldivesMaliMaltaMarshall IslandsMauritaniaMauritiusMexicoMicronesia, Fed. Sts.Middle East & North AfricaMiddle East & North Africa (excluding high income)Middle East & North Africa (IDA & IBRD countries)Middle incomeMoldovaMongoliaMontenegroMoroccoMozambiqueMyanmarNamibiaNepalNetherlandsNew CaledoniaNew ZealandNicaraguaNigerNigeriaNorth AmericaNorwayOECD membersOmanOther small statesPacific island small statesPakistanPalauPanamaPapua New GuineaParaguayPeruPhilippinesPolandPortugalPost-demographic dividendPre-demographic dividendQatarRomaniaRussian FederationRwandaSamoaSao Tome and PrincipeSaudi ArabiaSenegalSerbiaSeychellesSierra LeoneSingaporeSint Maarten (Dutch part)Slovak RepublicSloveniaSmall statesSolomon IslandsSouth AfricaSouth AsiaSouth Asia (IDA & IBRD)South SudanSpainSri LankaSt. Kitts and NevisSt. LuciaSt. Vincent and the GrenadinesSub-Saharan Africa Sub-Saharan Africa (excluding high income)Sub-Saharan Africa (IDA & IBRD countries)SudanSurinameSwazilandSwedenSwitzerlandSyrian Arab RepublicTajikistanTanzaniaThailandTimor-LesteTogoTongaTrinidad and TobagoTunisiaTurkeyTuvaluUgandaUkraineUnited KingdomUnited StatesUpper middle incomeUruguayVanuatuVenezuela, RBWest Bank and GazaWorldYemen, Rep.ZambiaZimbabwe Linea del tempo:
Questa scala temporale mostra un grafico dal 1961 anno al 2016 anno. Israel. I dati fino ad 1960 anno non disponibili. Il numero di osservazioni attuali secondo i date: 53.
La fonte (nome):
Indicatori dello sviluppo mondiale
La fonte (organizzazione):
International Monetary Fund, Balance of Payments Statistics Yearbook and data files.
Categorie:
Economy & Growth, Trade
sono stati aggiornati
23 apr 2017 anni
Indicatori delle variazioni dei valori per anni
Minima:
9.167
1 gen 1961 anni
Massimo:
36.163
1 gen 1982 anni
Alla data di osservazione
Valore
Variazione assoluta
La variazione rispetto al valore precedente
1 gen 1961 anni
9.167
+9.167
0.0%
1 gen 1962 anni
11.921
+2.754
30.04%
1 gen 1966 anni
15.278
+3.357
28.16%
1 gen 1967 anni
16.066
+0.788
5.16%
1 gen 1968 anni
20.588
+4.523
28.15%
1 gen 1969 anni
21.637
+1.049
5.1%
1 gen 1970 anni
20.331
-1.306
-6.04%
1 gen 1971 anni
17.66
-2.671
-13.14%
1 gen 1972 anni
18.513
+0.853
4.83%
1 gen 1973 anni
27.129
+8.617
46.54%
1 gen 1974 anni
29.659
+2.53
9.32%
1 gen 1975 anni
30.861
+1.202
4.05%
1 gen 1976 anni
30.551
-0.31
-1.0%
1 gen 1977 anni
27.033
-3.518
-11.52%
1 gen 1978 anni
28.023
+0.99
3.66%
1 gen 1979 anni
28.687
+0.664
2.37%
1 gen 1980 anni
33.849
+5.162
17.99%
1 gen 1981 anni
35.628
+1.779
5.25%
1 gen 1982 anni
36.163
+0.536
1.5%
1 gen 1983 anni
25.965
-10.199
-28.2%
1 gen 1984 anni
28.636
+2.671
10.29%
1 gen 1985 anni
25.844
-2.791
-9.75%
1 gen 1986 anni
22.188
-3.656
-14.15%
1 gen 1987 anni
27.949
+5.761
25.96%
1 gen 1988 anni
28.55
+0.601
2.15%
1 gen 1989 anni
28.308
-0.242
-0.85%
1 gen 1990 anni
29.478
+1.171
4.14%
1 gen 1991 anni
29.113
-0.365
-1.24%
1 gen 1992 anni
28.078
-1.036
-3.56%
1 gen 1993 anni
25.909
-2.169
-7.73%
1 gen 1994 anni
27.467
+1.559
6.02%
1 gen 1995 anni
28.126
+0.659
2.4%
1 gen 1996 anni
25.466
-2.66
-9.46%
1 gen 1997 anni
25.597
+0.131
0.51%
1 gen 1998 anni
25.369
-0.229
-0.89%
1 gen 1999 anni
26.717
+1.348
5.31%
1 gen 2000 anni
25.007
-1.71
-6.4%
1 gen 2001 anni
23.271
-1.736
-6.94%
1 gen 2002 anni
24.727
+1.456
6.26%
1 gen 2003 anni
23.465
-1.261
-5.1%
1 gen 2004 anni
22.762
-0.703
-3.0%
1 gen 2005 anni
20.867
-1.895
-8.33%
1 gen 2006 anni
20.939
+0.072
0.35%
1 gen 2007 anni
21.186
+0.247
1.18%
1 gen 2008 anni
20.758
-0.428
-2.02%
1 gen 2009 anni
18.561
-2.197
-10.58%
1 gen 2010 anni
18.81
+0.25
1.35%
1 gen 2011 anni
19.855
+1.045
5.55%
1 gen 2012 anni
18.905
-0.95
-4.79%
1 gen 2013 anni
16.951
-1.954
-10.33%
1 gen 2014 anni
18.641
+1.69
9.97%
1 gen 2015 anni
18.373
-0.268
-1.44%
1 gen 2016 anni
21.041
+2.668
14.52%
Classificazione dei paesi secondo i statistiche attuali per anni


Commenti: