29
/it/
it
AIzaSyAYiBZKx7MnpbEhh9jyipgxe19OcubqV5w
April 1, 2024
51654
North America
NAC
false
2
1
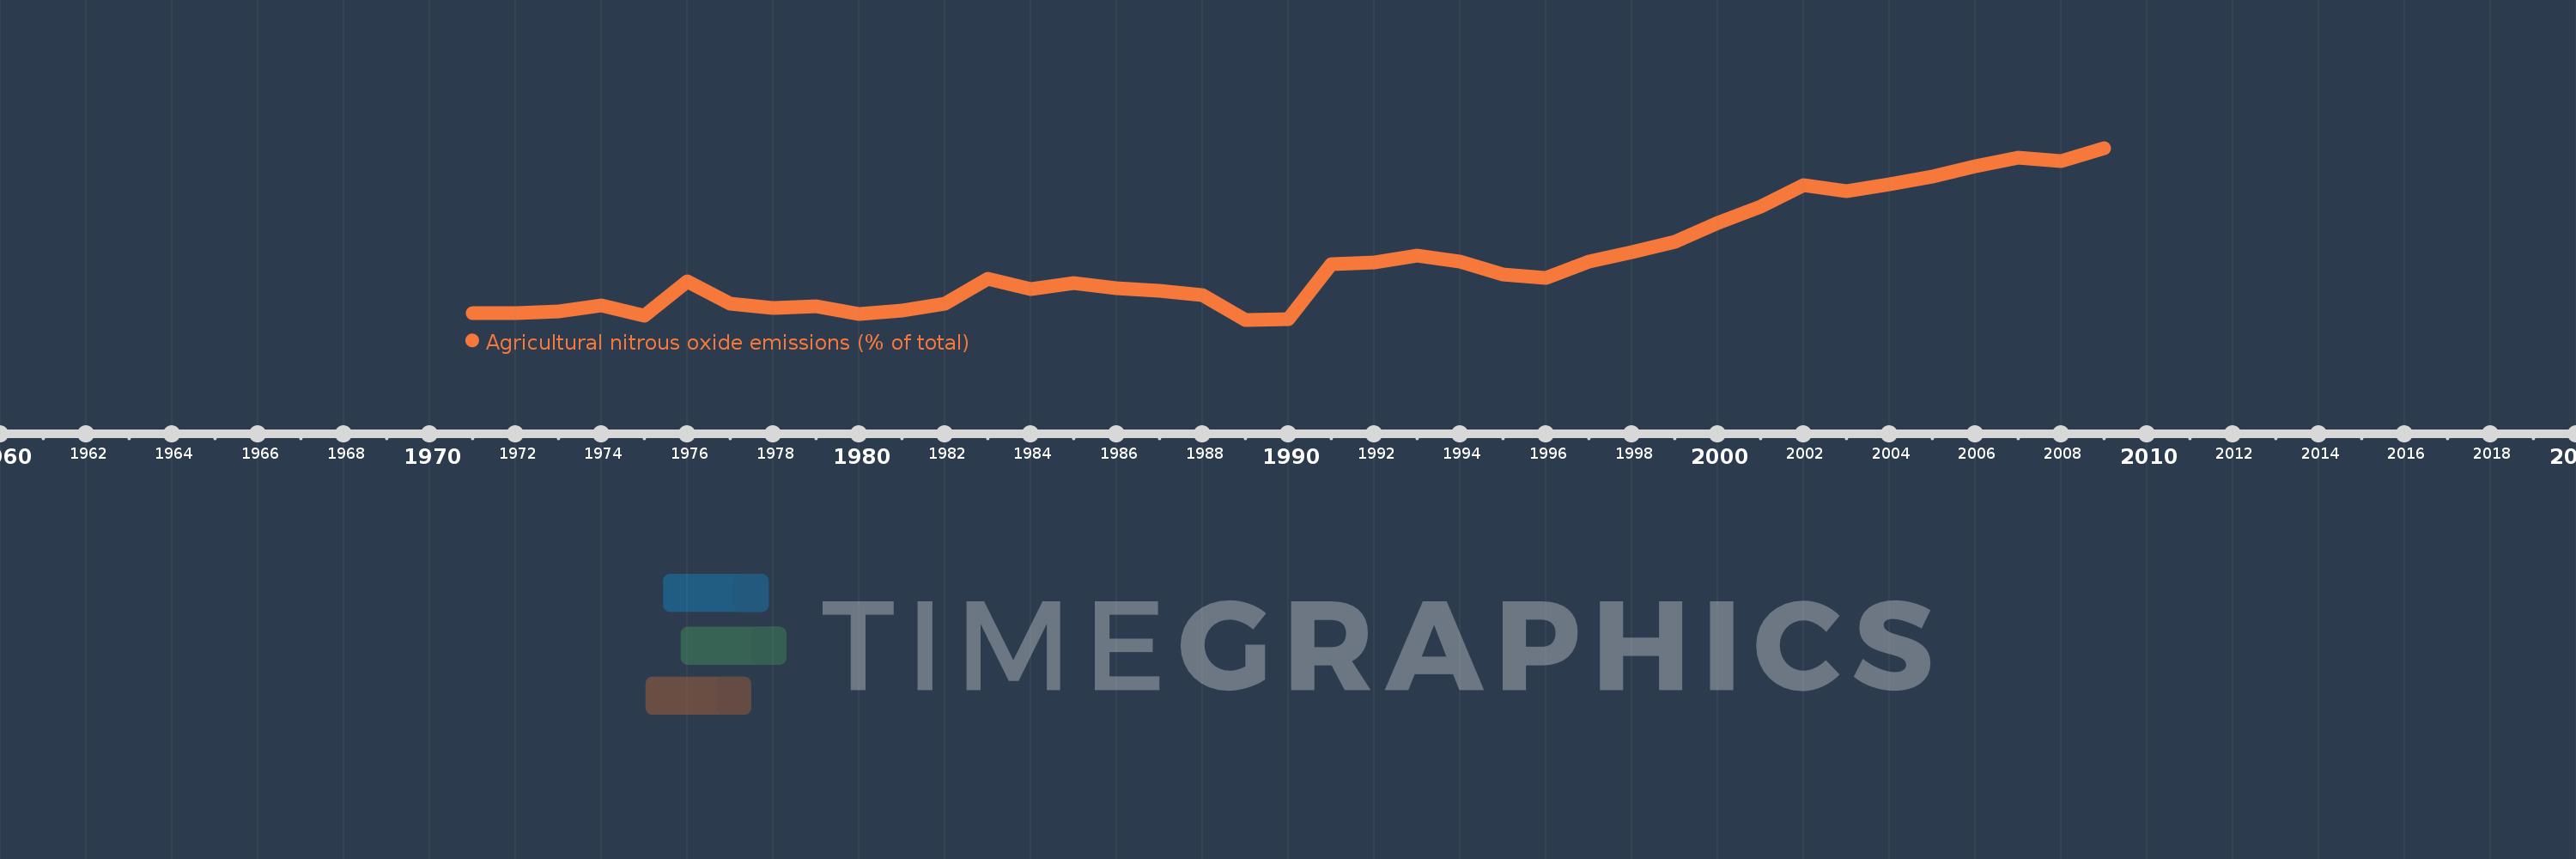
Agricultural nitrous oxide emissions (% of total)
2009,2008,2007,2006,2005,2004,2003,2002,2001,2000,1999,1998,1997,1996,1995,1994,1993,1992,1991,1990,1989,1988,1987,1986,1985,1984,1983,1982,1981,1980,1979,1978,1977,1976,1975,1974,1973,1972,1971
Queste statistiche in altri paesi:
AfghanistanAlbaniaAlgeriaAmerican SamoaAndorraAngolaAntigua and BarbudaArab WorldArgentinaArmeniaArubaAustraliaAustriaAzerbaijanBahamas, TheBahrainBangladeshBarbadosBelarusBelgiumBelizeBeninBermudaBhutanBoliviaBosnia and HerzegovinaBotswanaBrazilBritish Virgin IslandsBrunei DarussalamBulgariaBurkina FasoBurundiCabo VerdeCambodiaCameroonCanadaCaribbean small statesCayman IslandsCentral African RepublicCentral Europe and the BalticsChadChileChinaColombiaComorosCongo, Dem. Rep.Congo, Rep.Costa RicaCote d'IvoireCroatiaCubaCyprusCzech RepublicDenmarkDjiboutiDominicaDominican RepublicEarly-demographic dividendEast Asia & PacificEast Asia & Pacific (excluding high income)East Asia & Pacific (IDA & IBRD countries)EcuadorEgypt, Arab Rep.El SalvadorEquatorial GuineaEritreaEstoniaEthiopiaEuro areaEurope & Central AsiaEurope & Central Asia (excluding high income)Europe & Central Asia (IDA & IBRD countries)European UnionFaroe IslandsFijiFinlandFragile and conflict affected situationsFranceFrench PolynesiaGabonGambia, TheGeorgiaGermanyGhanaGibraltarGreeceGreenlandGrenadaGuamGuatemalaGuineaGuinea-BissauGuyanaHaitiHeavily indebted poor countries (HIPC)High incomeHondurasHong Kong SAR, ChinaHungaryIBRD onlyIcelandIDA & IBRD totalIDA blendIDA onlyIDA totalIndiaIndonesiaIran, Islamic Rep.IraqIrelandIsraelItalyJamaicaJapanJordanKazakhstanKenyaKiribatiKorea, Dem. People’s Rep.Korea, Rep.KuwaitKyrgyz RepublicLao PDRLate-demographic dividendLatin America & Caribbean Latin America & Caribbean (excluding high income)Latin America & the Caribbean (IDA & IBRD countries)LatviaLeast developed countries: UN classificationLebanonLesothoLiberiaLibyaLithuaniaLow & middle incomeLow incomeLower middle incomeLuxembourgMacao SAR, ChinaMacedonia, FYRMadagascarMalawiMalaysiaMaldivesMaliMaltaMarshall IslandsMauritaniaMauritiusMexicoMicronesia, Fed. Sts.Middle East & North AfricaMiddle East & North Africa (excluding high income)Middle East & North Africa (IDA & IBRD countries)Middle incomeMoldovaMongoliaMoroccoMozambiqueMyanmarNamibiaNauruNepalNetherlandsNew CaledoniaNew ZealandNicaraguaNigerNigeriaNorth AmericaNorthern Mariana IslandsNorwayOECD membersOmanOther small statesPacific island small statesPakistanPalauPanamaPapua New GuineaParaguayPeruPhilippinesPolandPortugalPost-demographic dividendPre-demographic dividendPuerto RicoQatarRomaniaRussian FederationRwandaSamoaSao Tome and PrincipeSaudi ArabiaSenegalSerbiaSeychellesSierra LeoneSingaporeSlovak RepublicSloveniaSmall statesSolomon IslandsSomaliaSouth AfricaSouth AsiaSouth Asia (IDA & IBRD)SpainSri LankaSt. Kitts and NevisSt. LuciaSt. Vincent and the GrenadinesSub-Saharan Africa Sub-Saharan Africa (excluding high income)Sub-Saharan Africa (IDA & IBRD countries)SudanSurinameSwazilandSwedenSwitzerlandSyrian Arab RepublicTajikistanTanzaniaThailandTimor-LesteTogoTongaTrinidad and TobagoTunisiaTurkeyTurkmenistanTurks and Caicos IslandsTuvaluUgandaUkraineUnited Arab EmiratesUnited KingdomUnited StatesUpper middle incomeUruguayUzbekistanVanuatuVenezuela, RBVietnamVirgin Islands (U.S.)WorldYemen, Rep.ZambiaZimbabwe Linea del tempo:
Questa scala temporale mostra un grafico dal 1971 anno al 2009 anno. North America. I dati fino ad 1970 anno non disponibili. Il numero di osservazioni attuali secondo i date: 39.
La fonte (nome):
Indicatori dello sviluppo mondiale
La fonte (organizzazione):
World Bank staff estimates from original source: European Commission, Joint Research Centre (JRC)/Netherlands Environmental Assessment Agency (PBL). Emission Database for Global Atmospheric Research (EDGAR): http://edgar.jrc.ec.europa.eu/.
Categorie:
Agriculture & Rural Development, Environment
sono stati aggiornati
23 apr 2017 anni
Indicatori delle variazioni dei valori per anni
Minima:
38.569
1 gen 1989 anni
Massimo:
58.458
1 gen 2009 anni
Alla data di osservazione
Valore
Variazione assoluta
La variazione rispetto al valore precedente
1 gen 1971 anni
39.309
+39.309
0.0%
1 gen 1972 anni
39.37
+0.061
0.16%
1 gen 1973 anni
39.539
+0.169
0.43%
1 gen 1974 anni
40.223
+0.685
1.73%
1 gen 1975 anni
39.072
-1.152
-2.86%
1 gen 1976 anni
42.993
+3.922
10.04%
1 gen 1977 anni
40.425
-2.568
-5.97%
1 gen 1978 anni
39.903
-0.522
-1.29%
1 gen 1979 anni
40.089
+0.186
0.46%
1 gen 1980 anni
39.188
-0.901
-2.25%
1 gen 1981 anni
39.668
+0.481
1.23%
1 gen 1982 anni
40.382
+0.713
1.8%
1 gen 1983 anni
43.282
+2.9
7.18%
1 gen 1984 anni
42.149
-1.133
-2.62%
1 gen 1985 anni
42.778
+0.629
1.49%
1 gen 1986 anni
42.221
-0.556
-1.3%
1 gen 1987 anni
41.934
-0.287
-0.68%
1 gen 1988 anni
41.375
-0.559
-1.33%
1 gen 1989 anni
38.569
-2.806
-6.78%
1 gen 1990 anni
38.619
+0.05
0.13%
1 gen 1991 anni
45.0
+6.382
16.52%
1 gen 1992 anni
45.174
+0.174
0.39%
1 gen 1993 anni
45.978
+0.804
1.78%
1 gen 1994 anni
45.344
-0.634
-1.38%
1 gen 1995 anni
43.806
-1.537
-3.39%
1 gen 1996 anni
43.433
-0.374
-0.85%
1 gen 1997 anni
45.273
+1.84
4.24%
1 gen 1998 anni
46.395
+1.123
2.48%
1 gen 1999 anni
47.581
+1.185
2.55%
1 gen 2000 anni
49.773
+2.192
4.61%
1 gen 2001 anni
51.699
+1.926
3.87%
1 gen 2002 anni
54.137
+2.438
4.72%
1 gen 2003 anni
53.429
-0.708
-1.31%
1 gen 2004 anni
54.275
+0.846
1.58%
1 gen 2005 anni
55.175
+0.9
1.66%
1 gen 2006 anni
56.3
+1.125
2.04%
1 gen 2007 anni
57.348
+1.049
1.86%
1 gen 2008 anni
56.94
-0.408
-0.71%
1 gen 2009 anni
58.458
+1.517
2.67%
Classificazione dei paesi secondo i statistiche attuali per anni


Commenti: