29
/it/
it
AIzaSyAYiBZKx7MnpbEhh9jyipgxe19OcubqV5w
April 1, 2024
27851
East Asia & Pacific (excluding high income)
EAP
false
2
1
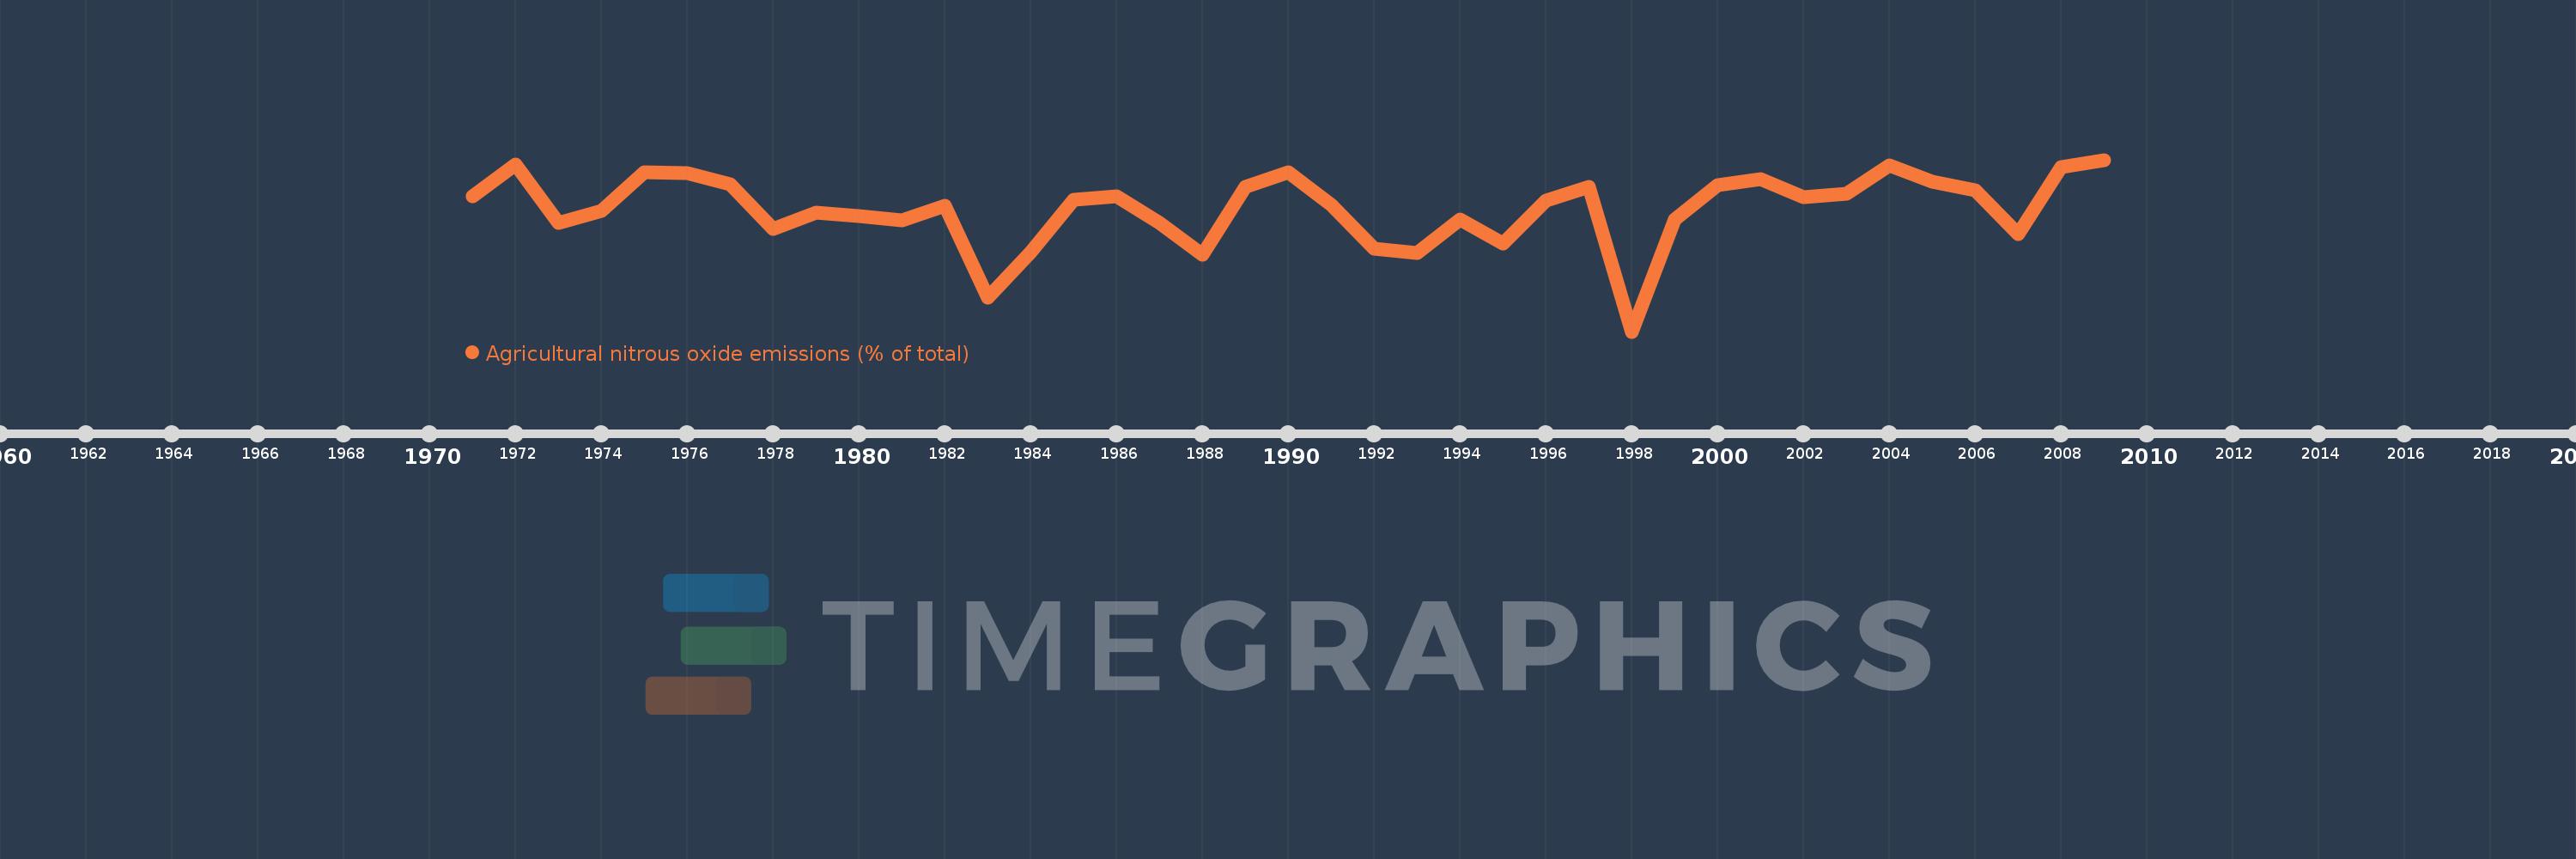
Agricultural nitrous oxide emissions (% of total)
2009,2008,2007,2006,2005,2004,2003,2002,2001,2000,1999,1998,1997,1996,1995,1994,1993,1992,1991,1990,1989,1988,1987,1986,1985,1984,1983,1982,1981,1980,1979,1978,1977,1976,1975,1974,1973,1972,1971
Queste statistiche in altri paesi:
AfghanistanAlbaniaAlgeriaAmerican SamoaAndorraAngolaAntigua and BarbudaArab WorldArgentinaArmeniaArubaAustraliaAustriaAzerbaijanBahamas, TheBahrainBangladeshBarbadosBelarusBelgiumBelizeBeninBermudaBhutanBoliviaBosnia and HerzegovinaBotswanaBrazilBritish Virgin IslandsBrunei DarussalamBulgariaBurkina FasoBurundiCabo VerdeCambodiaCameroonCanadaCaribbean small statesCayman IslandsCentral African RepublicCentral Europe and the BalticsChadChileChinaColombiaComorosCongo, Dem. Rep.Congo, Rep.Costa RicaCote d'IvoireCroatiaCubaCyprusCzech RepublicDenmarkDjiboutiDominicaDominican RepublicEarly-demographic dividendEast Asia & PacificEast Asia & Pacific (excluding high income)East Asia & Pacific (IDA & IBRD countries)EcuadorEgypt, Arab Rep.El SalvadorEquatorial GuineaEritreaEstoniaEthiopiaEuro areaEurope & Central AsiaEurope & Central Asia (excluding high income)Europe & Central Asia (IDA & IBRD countries)European UnionFaroe IslandsFijiFinlandFragile and conflict affected situationsFranceFrench PolynesiaGabonGambia, TheGeorgiaGermanyGhanaGibraltarGreeceGreenlandGrenadaGuamGuatemalaGuineaGuinea-BissauGuyanaHaitiHeavily indebted poor countries (HIPC)High incomeHondurasHong Kong SAR, ChinaHungaryIBRD onlyIcelandIDA & IBRD totalIDA blendIDA onlyIDA totalIndiaIndonesiaIran, Islamic Rep.IraqIrelandIsraelItalyJamaicaJapanJordanKazakhstanKenyaKiribatiKorea, Dem. People’s Rep.Korea, Rep.KuwaitKyrgyz RepublicLao PDRLate-demographic dividendLatin America & Caribbean Latin America & Caribbean (excluding high income)Latin America & the Caribbean (IDA & IBRD countries)LatviaLeast developed countries: UN classificationLebanonLesothoLiberiaLibyaLithuaniaLow & middle incomeLow incomeLower middle incomeLuxembourgMacao SAR, ChinaMacedonia, FYRMadagascarMalawiMalaysiaMaldivesMaliMaltaMarshall IslandsMauritaniaMauritiusMexicoMicronesia, Fed. Sts.Middle East & North AfricaMiddle East & North Africa (excluding high income)Middle East & North Africa (IDA & IBRD countries)Middle incomeMoldovaMongoliaMoroccoMozambiqueMyanmarNamibiaNauruNepalNetherlandsNew CaledoniaNew ZealandNicaraguaNigerNigeriaNorth AmericaNorthern Mariana IslandsNorwayOECD membersOmanOther small statesPacific island small statesPakistanPalauPanamaPapua New GuineaParaguayPeruPhilippinesPolandPortugalPost-demographic dividendPre-demographic dividendPuerto RicoQatarRomaniaRussian FederationRwandaSamoaSao Tome and PrincipeSaudi ArabiaSenegalSerbiaSeychellesSierra LeoneSingaporeSlovak RepublicSloveniaSmall statesSolomon IslandsSomaliaSouth AfricaSouth AsiaSouth Asia (IDA & IBRD)SpainSri LankaSt. Kitts and NevisSt. LuciaSt. Vincent and the GrenadinesSub-Saharan Africa Sub-Saharan Africa (excluding high income)Sub-Saharan Africa (IDA & IBRD countries)SudanSurinameSwazilandSwedenSwitzerlandSyrian Arab RepublicTajikistanTanzaniaThailandTimor-LesteTogoTongaTrinidad and TobagoTunisiaTurkeyTurkmenistanTurks and Caicos IslandsTuvaluUgandaUkraineUnited Arab EmiratesUnited KingdomUnited StatesUpper middle incomeUruguayUzbekistanVanuatuVenezuela, RBVietnamVirgin Islands (U.S.)WorldYemen, Rep.ZambiaZimbabwe Linea del tempo:
Questa scala temporale mostra un grafico dal 1971 anno al 2009 anno. East Asia & Pacific (excluding high income). I dati fino ad 1970 anno non disponibili. Il numero di osservazioni attuali secondo i date: 39.
La fonte (nome):
Indicatori dello sviluppo mondiale
La fonte (organizzazione):
World Bank staff estimates from original source: European Commission, Joint Research Centre (JRC)/Netherlands Environmental Assessment Agency (PBL). Emission Database for Global Atmospheric Research (EDGAR): http://edgar.jrc.ec.europa.eu/.
Categorie:
Agriculture & Rural Development, Environment
sono stati aggiornati
23 apr 2017 anni
Indicatori delle variazioni dei valori per anni
Minima:
48.321
1 gen 1998 anni
Massimo:
72.421
1 gen 2009 anni
Alla data di osservazione
Valore
Variazione assoluta
La variazione rispetto al valore precedente
1 gen 1971 anni
67.352
+67.352
0.0%
1 gen 1972 anni
71.74
+4.388
6.51%
1 gen 1973 anni
63.554
-8.186
-11.41%
1 gen 1974 anni
65.237
+1.683
2.65%
1 gen 1975 anni
70.665
+5.428
8.32%
1 gen 1976 anni
70.498
-0.167
-0.24%
1 gen 1977 anni
68.947
-1.551
-2.2%
1 gen 1978 anni
62.751
-6.196
-8.99%
1 gen 1979 anni
65.002
+2.251
3.59%
1 gen 1980 anni
64.536
-0.466
-0.72%
1 gen 1981 anni
63.908
-0.628
-0.97%
1 gen 1982 anni
65.94
+2.032
3.18%
1 gen 1983 anni
53.052
-12.887
-19.54%
1 gen 1984 anni
59.494
+6.441
12.14%
1 gen 1985 anni
66.799
+7.305
12.28%
1 gen 1986 anni
67.333
+0.534
0.8%
1 gen 1987 anni
63.564
-3.769
-5.6%
1 gen 1988 anni
59.074
-4.49
-7.06%
1 gen 1989 anni
68.626
+9.552
16.17%
1 gen 1990 anni
70.687
+2.061
3.0%
1 gen 1991 anni
66.14
-4.548
-6.43%
1 gen 1992 anni
59.996
-6.144
-9.29%
1 gen 1993 anni
59.297
-0.699
-1.16%
1 gen 1994 anni
64.094
+4.797
8.09%
1 gen 1995 anni
60.628
-3.467
-5.41%
1 gen 1996 anni
66.693
+6.065
10.0%
1 gen 1997 anni
68.588
+1.895
2.84%
1 gen 1998 anni
48.321
-20.267
-29.55%
1 gen 1999 anni
64.056
+15.735
32.56%
1 gen 2000 anni
68.881
+4.825
7.53%
1 gen 2001 anni
69.745
+0.864
1.25%
1 gen 2002 anni
67.239
-2.506
-3.59%
1 gen 2003 anni
67.664
+0.424
0.63%
1 gen 2004 anni
71.62
+3.957
5.85%
1 gen 2005 anni
69.342
-2.279
-3.18%
1 gen 2006 anni
68.098
-1.243
-1.79%
1 gen 2007 anni
62.021
-6.078
-8.92%
1 gen 2008 anni
71.415
+9.395
15.15%
1 gen 2009 anni
72.421
+1.006
1.41%
Classificazione dei paesi secondo i statistiche attuali per anni


Commenti: