29
/it/
it
AIzaSyAYiBZKx7MnpbEhh9jyipgxe19OcubqV5w
April 1, 2024
50402
Middle East & North Africa (IDA & IBRD countries)
TMN
false
2
1
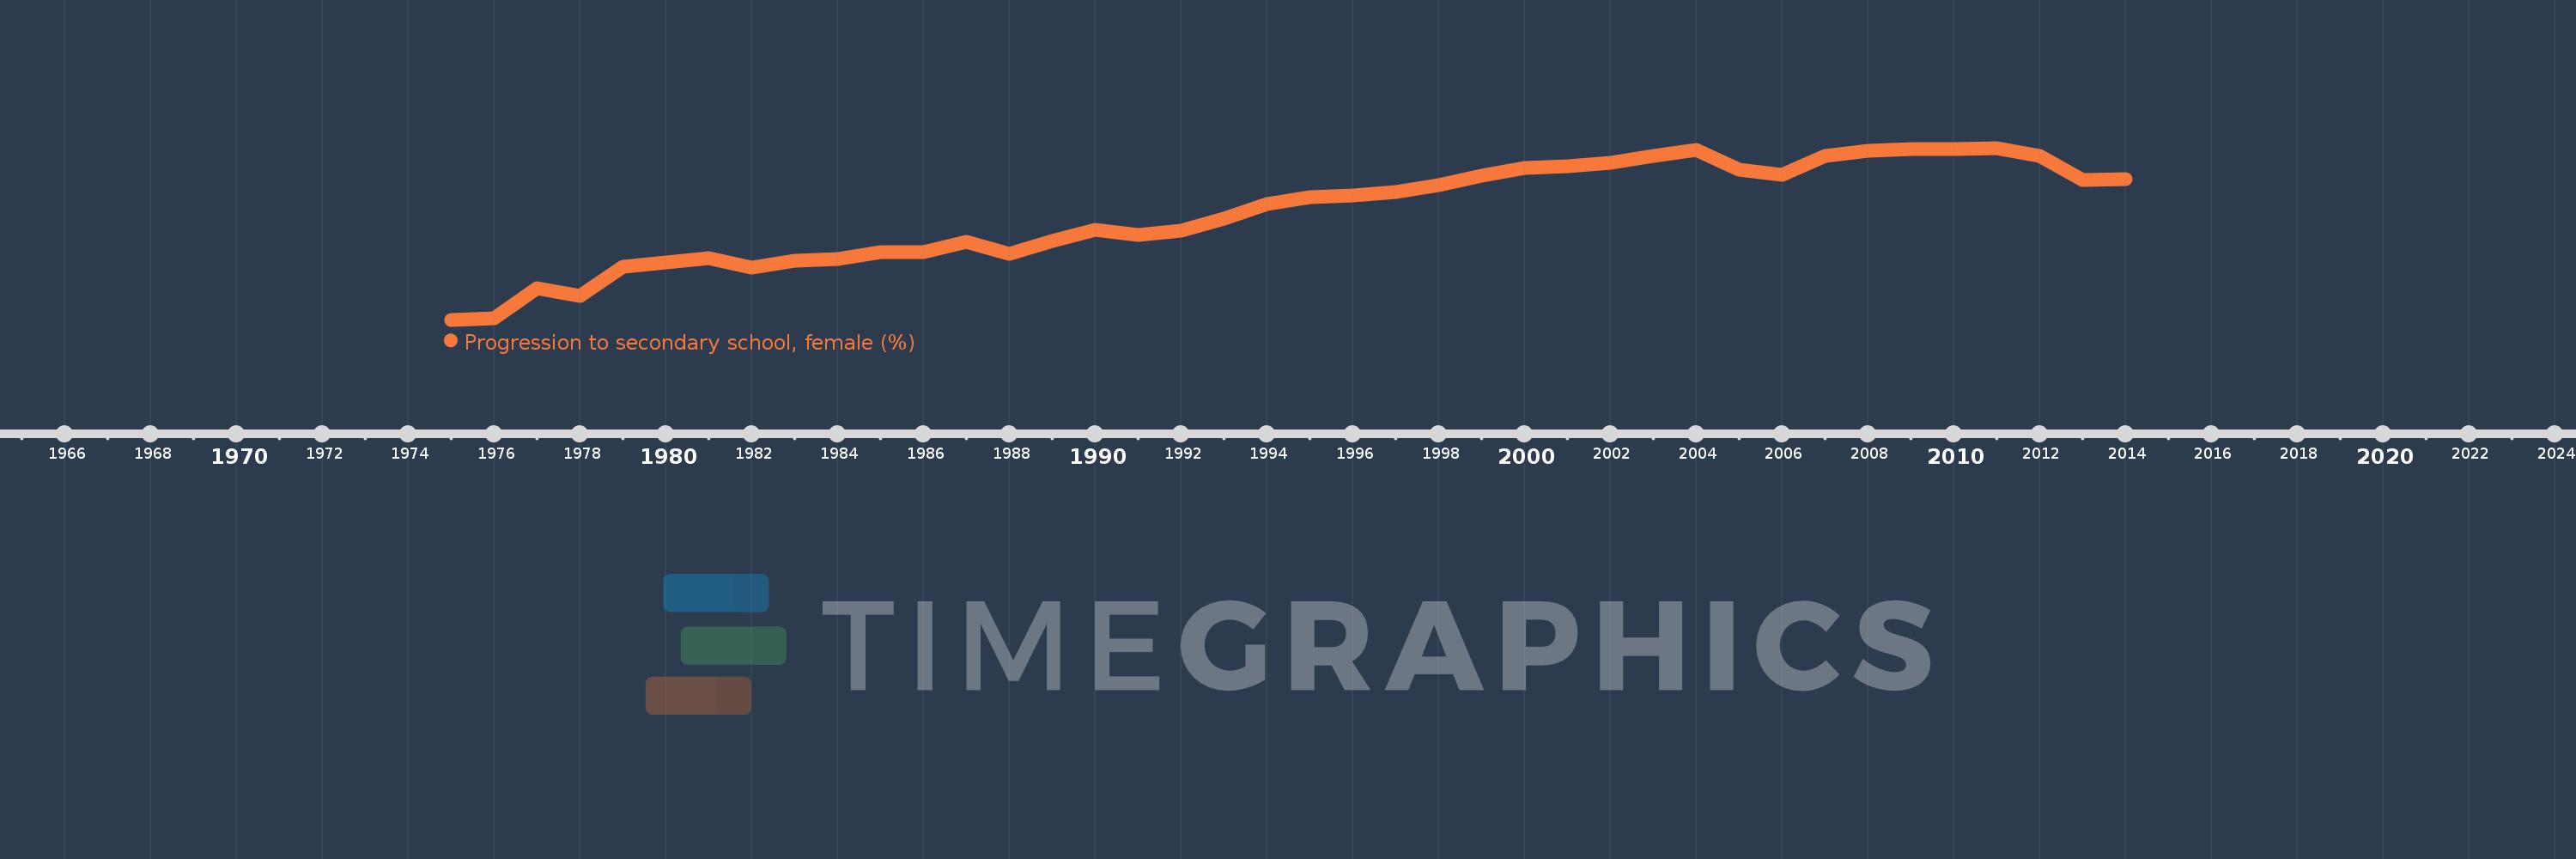
Progression to secondary school, female (%)
2014,2013,2012,2011,2010,2009,2008,2007,2006,2005,2004,2003,2002,2001,2000,1999,1998,1997,1996,1995,1994,1993,1992,1991,1990,1989,1988,1987,1986,1985,1984,1983,1982,1981,1979,1978,1977,1976,1975
Queste statistiche in altri paesi:
AfghanistanAlbaniaAlgeriaAngolaAntigua and BarbudaArab WorldArgentinaArmeniaArubaAustriaAzerbaijanBahamas, TheBahrainBarbadosBelarusBelgiumBelizeBeninBermudaBhutanBoliviaBosnia and HerzegovinaBotswanaBrazilBritish Virgin IslandsBrunei DarussalamBulgariaBurkina FasoBurundiCabo VerdeCambodiaCameroonCaribbean small statesCayman IslandsCentral African RepublicCentral Europe and the BalticsChadChileChinaColombiaComorosCongo, Dem. Rep.Congo, Rep.Costa RicaCote d'IvoireCroatiaCubaCyprusCzech RepublicDenmarkDjiboutiDominicaDominican RepublicEarly-demographic dividendEast Asia & PacificEast Asia & Pacific (excluding high income)East Asia & Pacific (IDA & IBRD countries)EcuadorEgypt, Arab Rep.El SalvadorEquatorial GuineaEritreaEstoniaEthiopiaEuro areaEurope & Central AsiaEurope & Central Asia (excluding high income)Europe & Central Asia (IDA & IBRD countries)European UnionFijiFinlandFragile and conflict affected situationsGabonGambia, TheGeorgiaGermanyGhanaGreeceGrenadaGuatemalaGuineaGuinea-BissauGuyanaHaitiHeavily indebted poor countries (HIPC)High incomeHondurasHong Kong SAR, ChinaHungaryIBRD onlyIcelandIDA & IBRD totalIDA blendIDA onlyIDA totalIndiaIndonesiaIran, Islamic Rep.IraqIsraelItalyJamaicaJapanJordanKazakhstanKenyaKiribatiKorea, Rep.KuwaitKyrgyz RepublicLao PDRLate-demographic dividendLatin America & Caribbean Latin America & Caribbean (excluding high income)Latin America & the Caribbean (IDA & IBRD countries)LatviaLeast developed countries: UN classificationLebanonLesothoLiberiaLibyaLiechtensteinLithuaniaLow & middle incomeLow incomeLower middle incomeLuxembourgMacao SAR, ChinaMacedonia, FYRMadagascarMalawiMalaysiaMaldivesMaliMaltaMarshall IslandsMauritaniaMauritiusMexicoMiddle East & North AfricaMiddle East & North Africa (excluding high income)Middle East & North Africa (IDA & IBRD countries)Middle incomeMoldovaMonacoMongoliaMoroccoMozambiqueMyanmarNamibiaNepalNetherlandsNicaraguaNigerNorwayOECD membersOmanOther small statesPacific island small statesPakistanPalauPanamaParaguayPeruPhilippinesPolandPortugalPost-demographic dividendPre-demographic dividendQatarRomaniaRussian FederationRwandaSamoaSan MarinoSao Tome and PrincipeSaudi ArabiaSenegalSerbiaSeychellesSierra LeoneSingaporeSlovak RepublicSloveniaSmall statesSolomon IslandsSouth AfricaSouth AsiaSouth Asia (IDA & IBRD)SpainSri LankaSt. Kitts and NevisSt. LuciaSt. Vincent and the GrenadinesSub-Saharan Africa Sub-Saharan Africa (excluding high income)Sub-Saharan Africa (IDA & IBRD countries)SudanSurinameSwazilandSwedenSwitzerlandSyrian Arab RepublicTajikistanTanzaniaThailandTimor-LesteTogoTongaTrinidad and TobagoTunisiaTurkeyTurks and Caicos IslandsTuvaluUgandaUkraineUnited Arab EmiratesUpper middle incomeUruguayUzbekistanVanuatuVenezuela, RBVietnamWest Bank and GazaWorldYemen, Rep.ZambiaZimbabwe Linea del tempo:
Questa scala temporale mostra un grafico dal 1975 anno al 2014 anno. Middle East & North Africa (IDA & IBRD countries). I dati fino ad 1974 anno non disponibili. Il numero di osservazioni attuali secondo i date: 39.
La fonte (nome):
Indicatori dello sviluppo mondiale
La fonte (organizzazione):
United Nations Educational, Scientific, and Cultural Organization (UNESCO) Institute for Statistics.
Categorie:
Education, Gender
sono stati aggiornati
23 apr 2017 anni
Indicatori delle variazioni dei valori per anni
Minima:
62.615
1 gen 1975 anni
Massimo:
93.232
1 gen 2011 anni
Alla data di osservazione
Valore
Variazione assoluta
La variazione rispetto al valore precedente
1 gen 1975 anni
62.615
+62.615
0.0%
1 gen 1976 anni
62.842
+0.227
0.36%
1 gen 1977 anni
68.248
+5.405
8.6%
1 gen 1978 anni
66.83
-1.418
-2.08%
1 gen 1979 anni
72.089
+5.26
7.87%
1 gen 1981 anni
73.516
+1.426
1.98%
1 gen 1982 anni
71.888
-1.628
-2.21%
1 gen 1983 anni
73.078
+1.19
1.65%
1 gen 1984 anni
73.396
+0.318
0.44%
1 gen 1985 anni
74.723
+1.327
1.81%
1 gen 1986 anni
74.705
-0.018
-0.02%
1 gen 1987 anni
76.469
+1.764
2.36%
1 gen 1988 anni
74.342
-2.127
-2.78%
1 gen 1989 anni
76.67
+2.328
3.13%
1 gen 1990 anni
78.703
+2.033
2.65%
1 gen 1991 anni
77.76
-0.943
-1.2%
1 gen 1992 anni
78.495
+0.735
0.95%
1 gen 1993 anni
80.664
+2.169
2.76%
1 gen 1994 anni
83.288
+2.624
3.25%
1 gen 1995 anni
84.455
+1.167
1.4%
1 gen 1996 anni
84.721
+0.266
0.31%
1 gen 1997 anni
85.392
+0.671
0.79%
1 gen 1998 anni
86.539
+1.147
1.34%
1 gen 1999 anni
88.319
+1.78
2.06%
1 gen 2000 anni
89.71
+1.391
1.58%
1 gen 2001 anni
89.984
+0.274
0.31%
1 gen 2002 anni
90.632
+0.647
0.72%
1 gen 2003 anni
91.875
+1.244
1.37%
1 gen 2004 anni
92.94
+1.065
1.16%
1 gen 2005 anni
89.413
-3.527
-3.79%
1 gen 2006 anni
88.501
-0.912
-1.02%
1 gen 2007 anni
91.823
+3.322
3.75%
1 gen 2008 anni
92.753
+0.93
1.01%
1 gen 2009 anni
93.101
+0.348
0.38%
1 gen 2010 anni
93.082
-0.019
-0.02%
1 gen 2011 anni
93.232
+0.15
0.16%
1 gen 2012 anni
91.88
-1.353
-1.45%
1 gen 2013 anni
87.525
-4.355
-4.74%
1 gen 2014 anni
87.69
+0.166
0.19%
Classificazione dei paesi secondo i statistiche attuali per anni


Commenti: