29
/it/
it
AIzaSyAYiBZKx7MnpbEhh9jyipgxe19OcubqV5w
April 1, 2024
161900
Italy
ITA
true
2
1
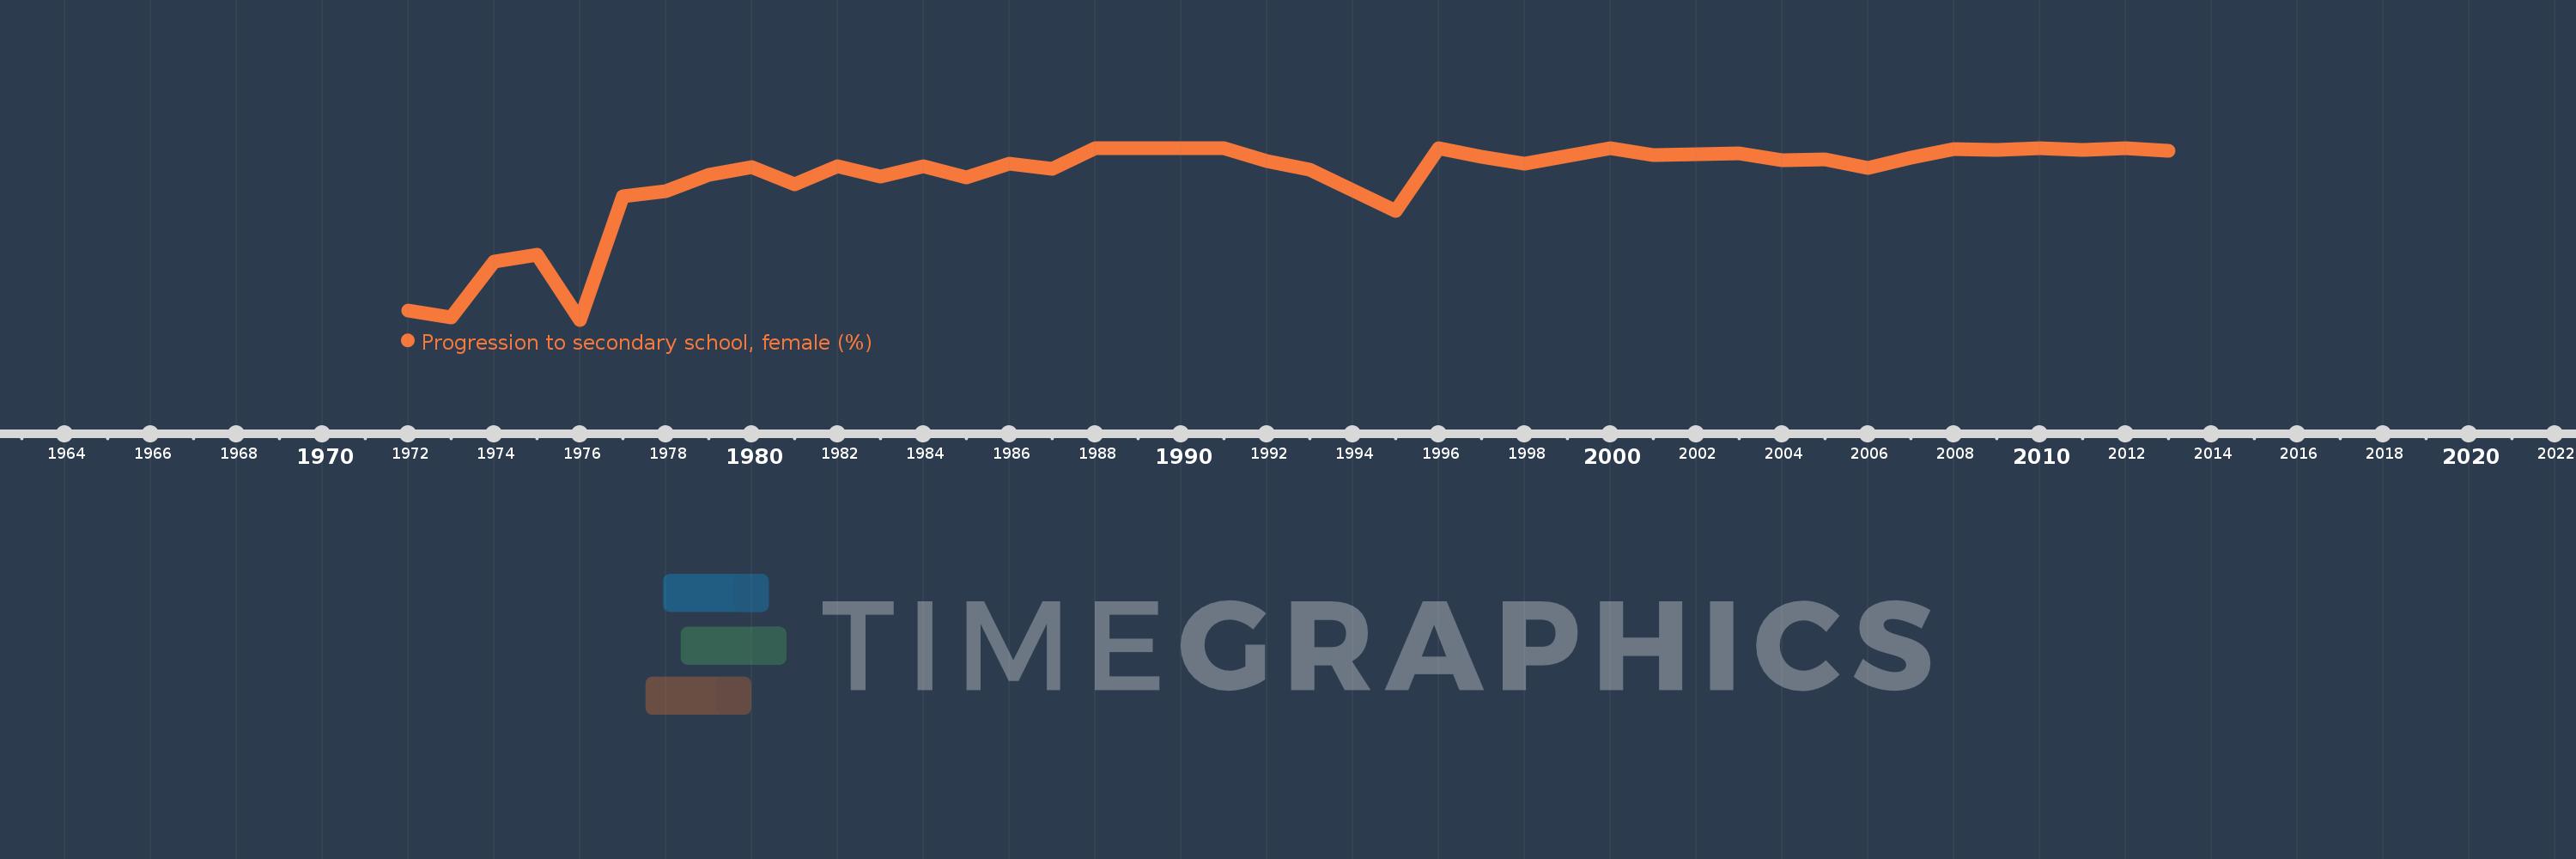
Progression to secondary school, female (%)
2013,2012,2011,2010,2009,2008,2007,2006,2005,2004,2003,2002,2001,2000,1998,1997,1996,1995,1993,1992,1991,1990,1989,1988,1987,1986,1985,1984,1983,1982,1981,1980,1979,1978,1977,1976,1975,1974,1973,1972
Queste statistiche in altri paesi:
AfghanistanAlbaniaAlgeriaAngolaAntigua and BarbudaArab WorldArgentinaArmeniaArubaAustriaAzerbaijanBahamas, TheBahrainBarbadosBelarusBelgiumBelizeBeninBermudaBhutanBoliviaBosnia and HerzegovinaBotswanaBrazilBritish Virgin IslandsBrunei DarussalamBulgariaBurkina FasoBurundiCabo VerdeCambodiaCameroonCaribbean small statesCayman IslandsCentral African RepublicCentral Europe and the BalticsChadChileChinaColombiaComorosCongo, Dem. Rep.Congo, Rep.Costa RicaCote d'IvoireCroatiaCubaCyprusCzech RepublicDenmarkDjiboutiDominicaDominican RepublicEarly-demographic dividendEast Asia & PacificEast Asia & Pacific (excluding high income)East Asia & Pacific (IDA & IBRD countries)EcuadorEgypt, Arab Rep.El SalvadorEquatorial GuineaEritreaEstoniaEthiopiaEuro areaEurope & Central AsiaEurope & Central Asia (excluding high income)Europe & Central Asia (IDA & IBRD countries)European UnionFijiFinlandFragile and conflict affected situationsGabonGambia, TheGeorgiaGermanyGhanaGreeceGrenadaGuatemalaGuineaGuinea-BissauGuyanaHaitiHeavily indebted poor countries (HIPC)High incomeHondurasHong Kong SAR, ChinaHungaryIBRD onlyIcelandIDA & IBRD totalIDA blendIDA onlyIDA totalIndiaIndonesiaIran, Islamic Rep.IraqIsraelItalyJamaicaJapanJordanKazakhstanKenyaKiribatiKorea, Rep.KuwaitKyrgyz RepublicLao PDRLate-demographic dividendLatin America & Caribbean Latin America & Caribbean (excluding high income)Latin America & the Caribbean (IDA & IBRD countries)LatviaLeast developed countries: UN classificationLebanonLesothoLiberiaLibyaLiechtensteinLithuaniaLow & middle incomeLow incomeLower middle incomeLuxembourgMacao SAR, ChinaMacedonia, FYRMadagascarMalawiMalaysiaMaldivesMaliMaltaMarshall IslandsMauritaniaMauritiusMexicoMiddle East & North AfricaMiddle East & North Africa (excluding high income)Middle East & North Africa (IDA & IBRD countries)Middle incomeMoldovaMonacoMongoliaMoroccoMozambiqueMyanmarNamibiaNepalNetherlandsNicaraguaNigerNorwayOECD membersOmanOther small statesPacific island small statesPakistanPalauPanamaParaguayPeruPhilippinesPolandPortugalPost-demographic dividendPre-demographic dividendQatarRomaniaRussian FederationRwandaSamoaSan MarinoSao Tome and PrincipeSaudi ArabiaSenegalSerbiaSeychellesSierra LeoneSingaporeSlovak RepublicSloveniaSmall statesSolomon IslandsSouth AfricaSouth AsiaSouth Asia (IDA & IBRD)SpainSri LankaSt. Kitts and NevisSt. LuciaSt. Vincent and the GrenadinesSub-Saharan Africa Sub-Saharan Africa (excluding high income)Sub-Saharan Africa (IDA & IBRD countries)SudanSurinameSwazilandSwedenSwitzerlandSyrian Arab RepublicTajikistanTanzaniaThailandTimor-LesteTogoTongaTrinidad and TobagoTunisiaTurkeyTurks and Caicos IslandsTuvaluUgandaUkraineUnited Arab EmiratesUpper middle incomeUruguayUzbekistanVanuatuVenezuela, RBVietnamWest Bank and GazaWorldYemen, Rep.ZambiaZimbabwe Linea del tempo:
Questa scala temporale mostra un grafico dal 1972 anno al 2013 anno. Italy. I dati fino ad 1971 anno non disponibili. Il numero di osservazioni attuali secondo i date: 40.
La fonte (nome):
Indicatori dello sviluppo mondiale
La fonte (organizzazione):
United Nations Educational, Scientific, and Cultural Organization (UNESCO) Institute for Statistics.
Categorie:
Education, Gender
sono stati aggiornati
23 apr 2017 anni
Indicatori delle variazioni dei valori per anni
Minima:
88.521
1 gen 1976 anni
Massimo:
100.0
1 gen 1988 anni
Alla data di osservazione
Valore
Variazione assoluta
La variazione rispetto al valore precedente
1 gen 1972 anni
89.119
+89.119
0.0%
1 gen 1973 anni
88.663
-0.456
-0.51%
1 gen 1974 anni
92.382
+3.718
4.19%
1 gen 1975 anni
92.842
+0.46
0.5%
1 gen 1976 anni
88.521
-4.321
-4.65%
1 gen 1977 anni
96.793
+8.272
9.35%
1 gen 1978 anni
97.126
+0.333
0.34%
1 gen 1979 anni
98.216
+1.09
1.12%
1 gen 1980 anni
98.736
+0.52
0.53%
1 gen 1981 anni
97.598
-1.137
-1.15%
1 gen 1982 anni
98.776
+1.178
1.21%
1 gen 1983 anni
98.11
-0.666
-0.67%
1 gen 1984 anni
98.796
+0.686
0.7%
1 gen 1985 anni
98.05
-0.746
-0.76%
1 gen 1986 anni
98.937
+0.888
0.91%
1 gen 1987 anni
98.586
-0.351
-0.35%
1 gen 1988 anni
100.0
+1.414
1.43%
1 gen 1989 anni
100.0
0.0
0.0%
1 gen 1990 anni
100.0
0.0
0.0%
1 gen 1991 anni
100.0
0.0
0.0%
1 gen 1992 anni
99.125
-0.875
-0.87%
1 gen 1993 anni
98.573
-0.552
-0.56%
1 gen 1995 anni
95.77
-2.803
-2.84%
1 gen 1996 anni
100.0
+4.23
4.42%
1 gen 1997 anni
99.418
-0.582
-0.58%
1 gen 1998 anni
98.961
-0.457
-0.46%
1 gen 2000 anni
100.0
+1.039
1.05%
1 gen 2001 anni
99.539
-0.461
-0.46%
1 gen 2002 anni
99.598
+0.059
0.06%
1 gen 2003 anni
99.66
+0.062
0.06%
1 gen 2004 anni
99.157
-0.503
-0.5%
1 gen 2005 anni
99.243
+0.086
0.09%
1 gen 2006 anni
98.67
-0.573
-0.58%
1 gen 2007 anni
99.346
+0.676
0.69%
1 gen 2008 anni
99.923
+0.577
0.58%
1 gen 2009 anni
99.886
-0.037
-0.04%
1 gen 2010 anni
100.0
+0.114
0.11%
1 gen 2011 anni
99.883
-0.117
-0.12%
1 gen 2012 anni
100.0
+0.117
0.12%
1 gen 2013 anni
99.786
-0.214
-0.21%
Classificazione dei paesi secondo i statistiche attuali per anni


Commenti: