29
/it/
it
AIzaSyAYiBZKx7MnpbEhh9jyipgxe19OcubqV5w
April 1, 2024
42437
Latin America & Caribbean (excluding high income)
LAC
false
2
1
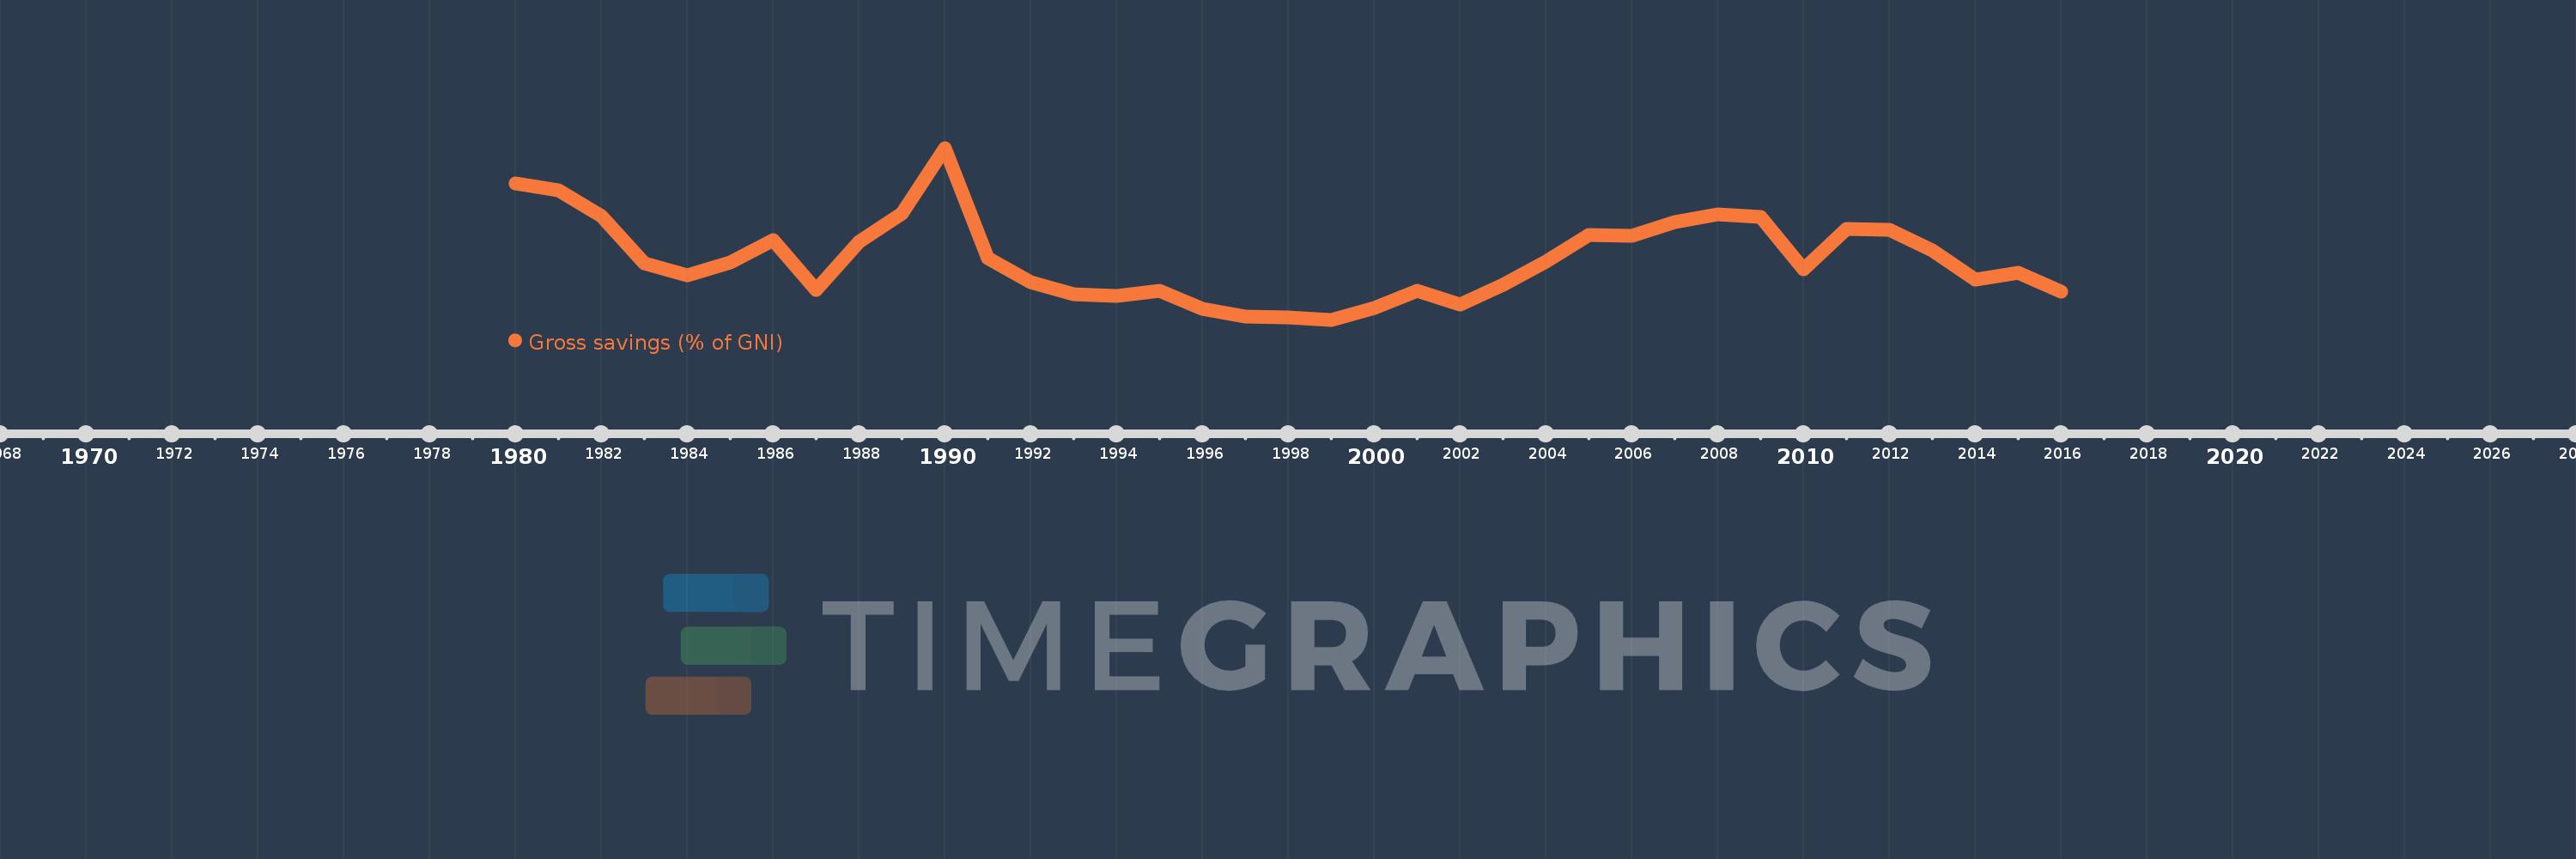
Gross savings (% of GNI)
2016,2015,2014,2013,2012,2011,2010,2009,2008,2007,2006,2005,2004,2003,2002,2001,2000,1999,1998,1997,1996,1995,1994,1993,1992,1991,1990,1989,1988,1987,1986,1985,1984,1983,1982,1981,1980
Queste statistiche in altri paesi:
AfghanistanAlbaniaAlgeriaAngolaAntigua and BarbudaArab WorldArgentinaArmeniaAustraliaAustriaAzerbaijanBahamas, TheBahrainBangladeshBarbadosBelarusBelgiumBelizeBeninBermudaBhutanBoliviaBosnia and HerzegovinaBotswanaBrazilBrunei DarussalamBulgariaBurkina FasoBurundiCabo VerdeCambodiaCameroonCanadaCaribbean small statesCentral African RepublicCentral Europe and the BalticsChadChileChinaColombiaComorosCongo, Dem. Rep.Congo, Rep.Costa RicaCote d'IvoireCroatiaCyprusCzech RepublicDenmarkDjiboutiDominicaDominican RepublicEarly-demographic dividendEast Asia & PacificEast Asia & Pacific (excluding high income)East Asia & Pacific (IDA & IBRD countries)EcuadorEgypt, Arab Rep.El SalvadorEquatorial GuineaEritreaEstoniaEthiopiaEuro areaEurope & Central AsiaEurope & Central Asia (excluding high income)Europe & Central Asia (IDA & IBRD countries)European UnionFaroe IslandsFijiFinlandFragile and conflict affected situationsFranceGabonGambia, TheGeorgiaGermanyGhanaGreeceGrenadaGuatemalaGuineaGuinea-BissauGuyanaHaitiHeavily indebted poor countries (HIPC)High incomeHondurasHong Kong SAR, ChinaHungaryIBRD onlyIcelandIDA & IBRD totalIDA blendIDA onlyIDA totalIndiaIndonesiaIran, Islamic Rep.IraqIrelandIsraelItalyJamaicaJapanJordanKazakhstanKenyaKiribatiKorea, Rep.KosovoKuwaitKyrgyz RepublicLao PDRLate-demographic dividendLatin America & Caribbean Latin America & Caribbean (excluding high income)Latin America & the Caribbean (IDA & IBRD countries)LatviaLeast developed countries: UN classificationLebanonLesothoLiberiaLibyaLithuaniaLow & middle incomeLow incomeLower middle incomeLuxembourgMacao SAR, ChinaMacedonia, FYRMadagascarMalawiMalaysiaMaldivesMaliMaltaMauritaniaMauritiusMexicoMiddle East & North AfricaMiddle East & North Africa (excluding high income)Middle East & North Africa (IDA & IBRD countries)Middle incomeMoldovaMongoliaMontenegroMoroccoMozambiqueNamibiaNepalNetherlandsNew ZealandNicaraguaNigerNigeriaNorth AmericaNorwayOECD membersOmanOther small statesPacific island small statesPakistanPanamaPapua New GuineaParaguayPeruPhilippinesPolandPortugalPost-demographic dividendPre-demographic dividendQatarRomaniaRussian FederationRwandaSaudi ArabiaSenegalSerbiaSeychellesSierra LeoneSingaporeSlovak RepublicSloveniaSmall statesSolomon IslandsSouth AfricaSouth AsiaSouth Asia (IDA & IBRD)South SudanSpainSri LankaSt. Kitts and NevisSt. LuciaSt. Vincent and the GrenadinesSub-Saharan Africa Sub-Saharan Africa (excluding high income)Sub-Saharan Africa (IDA & IBRD countries)SudanSurinameSwazilandSwedenSwitzerlandSyrian Arab RepublicTajikistanTanzaniaThailandTimor-LesteTogoTongaTrinidad and TobagoTunisiaTurkeyUgandaUkraineUnited KingdomUnited StatesUpper middle incomeUruguayVanuatuVenezuela, RBVietnamWest Bank and GazaWorldYemen, Rep.ZambiaZimbabwe Linea del tempo:
Questa scala temporale mostra un grafico dal 1980 anno al 2016 anno. Latin America & Caribbean (excluding high income). I dati fino ad 1979 anno non disponibili. Il numero di osservazioni attuali secondo i date: 37.
La fonte (nome):
Indicatori dello sviluppo mondiale
La fonte (organizzazione):
World Bank national accounts data, and OECD National Accounts data files.
Categorie:
Economy & Growth
sono stati aggiornati
23 apr 2017 anni
Indicatori delle variazioni dei valori per anni
Minima:
15.842
1 gen 1999 anni
Massimo:
26.469
1 gen 1990 anni
Alla data di osservazione
Valore
Variazione assoluta
La variazione rispetto al valore precedente
1 gen 1980 anni
24.248
+24.248
0.0%
1 gen 1981 anni
23.864
-0.384
-1.58%
1 gen 1982 anni
22.246
-1.618
-6.78%
1 gen 1983 anni
19.356
-2.89
-12.99%
1 gen 1984 anni
18.61
-0.746
-3.85%
1 gen 1985 anni
19.369
+0.759
4.08%
1 gen 1986 anni
20.76
+1.391
7.18%
1 gen 1987 anni
17.691
-3.068
-14.78%
1 gen 1988 anni
20.682
+2.99
16.9%
1 gen 1989 anni
22.42
+1.738
8.4%
1 gen 1990 anni
26.469
+4.05
18.06%
1 gen 1991 anni
19.655
-6.814
-25.74%
1 gen 1992 anni
18.169
-1.486
-7.56%
1 gen 1993 anni
17.437
-0.733
-4.03%
1 gen 1994 anni
17.332
-0.105
-0.6%
1 gen 1995 anni
17.652
+0.32
1.85%
1 gen 1996 anni
16.495
-1.157
-6.55%
1 gen 1997 anni
16.03
-0.465
-2.82%
1 gen 1998 anni
16.009
-0.021
-0.13%
1 gen 1999 anni
15.842
-0.167
-1.05%
1 gen 2000 anni
16.58
+0.739
4.66%
1 gen 2001 anni
17.635
+1.055
6.36%
1 gen 2002 anni
16.786
-0.849
-4.82%
1 gen 2003 anni
18.003
+1.218
7.25%
1 gen 2004 anni
19.426
+1.423
7.9%
1 gen 2005 anni
21.064
+1.638
8.43%
1 gen 2006 anni
21.045
-0.019
-0.09%
1 gen 2007 anni
21.857
+0.812
3.86%
1 gen 2008 anni
22.384
+0.527
2.41%
1 gen 2009 anni
22.181
-0.202
-0.9%
1 gen 2010 anni
18.952
-3.229
-14.56%
1 gen 2011 anni
21.469
+2.517
13.28%
1 gen 2012 anni
21.381
-0.088
-0.41%
1 gen 2013 anni
20.125
-1.256
-5.88%
1 gen 2014 anni
18.343
-1.781
-8.85%
1 gen 2015 anni
18.75
+0.407
2.22%
1 gen 2016 anni
17.589
-1.161
-6.19%
Classificazione dei paesi secondo i statistiche attuali per anni


Commenti: