29
/it/
it
AIzaSyAYiBZKx7MnpbEhh9jyipgxe19OcubqV5w
April 1, 2024
31640
Europe & Central Asia (excluding high income)
ECA
false
2
1
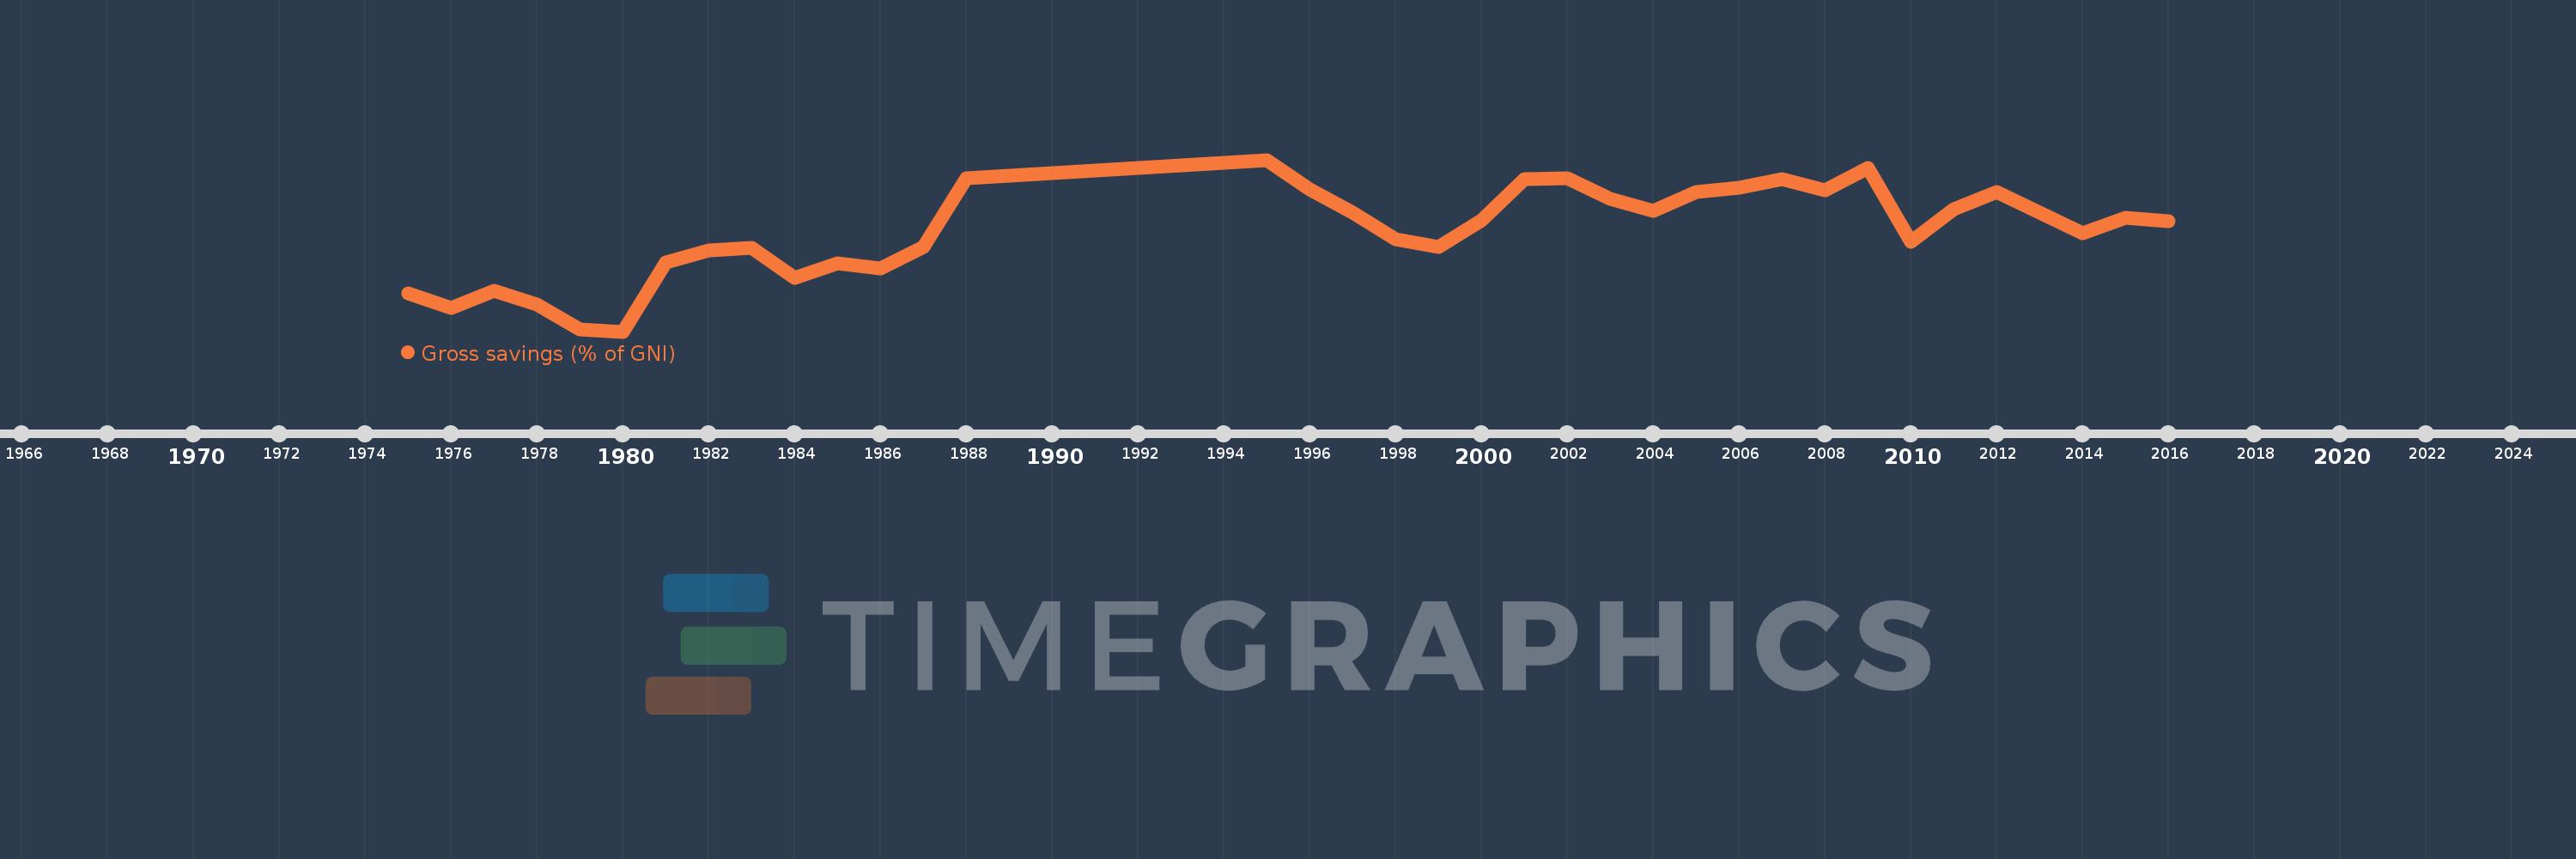
Gross savings (% of GNI)
2016,2015,2014,2013,2012,2011,2010,2009,2008,2007,2006,2005,2004,2003,2002,2001,2000,1999,1998,1997,1996,1995,1988,1987,1986,1985,1984,1983,1982,1981,1980,1979,1978,1977,1976,1975
Queste statistiche in altri paesi:
AfghanistanAlbaniaAlgeriaAngolaAntigua and BarbudaArab WorldArgentinaArmeniaAustraliaAustriaAzerbaijanBahamas, TheBahrainBangladeshBarbadosBelarusBelgiumBelizeBeninBermudaBhutanBoliviaBosnia and HerzegovinaBotswanaBrazilBrunei DarussalamBulgariaBurkina FasoBurundiCabo VerdeCambodiaCameroonCanadaCaribbean small statesCentral African RepublicCentral Europe and the BalticsChadChileChinaColombiaComorosCongo, Dem. Rep.Congo, Rep.Costa RicaCote d'IvoireCroatiaCyprusCzech RepublicDenmarkDjiboutiDominicaDominican RepublicEarly-demographic dividendEast Asia & PacificEast Asia & Pacific (excluding high income)East Asia & Pacific (IDA & IBRD countries)EcuadorEgypt, Arab Rep.El SalvadorEquatorial GuineaEritreaEstoniaEthiopiaEuro areaEurope & Central AsiaEurope & Central Asia (excluding high income)Europe & Central Asia (IDA & IBRD countries)European UnionFaroe IslandsFijiFinlandFragile and conflict affected situationsFranceGabonGambia, TheGeorgiaGermanyGhanaGreeceGrenadaGuatemalaGuineaGuinea-BissauGuyanaHaitiHeavily indebted poor countries (HIPC)High incomeHondurasHong Kong SAR, ChinaHungaryIBRD onlyIcelandIDA & IBRD totalIDA blendIDA onlyIDA totalIndiaIndonesiaIran, Islamic Rep.IraqIrelandIsraelItalyJamaicaJapanJordanKazakhstanKenyaKiribatiKorea, Rep.KosovoKuwaitKyrgyz RepublicLao PDRLate-demographic dividendLatin America & Caribbean Latin America & Caribbean (excluding high income)Latin America & the Caribbean (IDA & IBRD countries)LatviaLeast developed countries: UN classificationLebanonLesothoLiberiaLibyaLithuaniaLow & middle incomeLow incomeLower middle incomeLuxembourgMacao SAR, ChinaMacedonia, FYRMadagascarMalawiMalaysiaMaldivesMaliMaltaMauritaniaMauritiusMexicoMiddle East & North AfricaMiddle East & North Africa (excluding high income)Middle East & North Africa (IDA & IBRD countries)Middle incomeMoldovaMongoliaMontenegroMoroccoMozambiqueNamibiaNepalNetherlandsNew ZealandNicaraguaNigerNigeriaNorth AmericaNorwayOECD membersOmanOther small statesPacific island small statesPakistanPanamaPapua New GuineaParaguayPeruPhilippinesPolandPortugalPost-demographic dividendPre-demographic dividendQatarRomaniaRussian FederationRwandaSaudi ArabiaSenegalSerbiaSeychellesSierra LeoneSingaporeSlovak RepublicSloveniaSmall statesSolomon IslandsSouth AfricaSouth AsiaSouth Asia (IDA & IBRD)South SudanSpainSri LankaSt. Kitts and NevisSt. LuciaSt. Vincent and the GrenadinesSub-Saharan Africa Sub-Saharan Africa (excluding high income)Sub-Saharan Africa (IDA & IBRD countries)SudanSurinameSwazilandSwedenSwitzerlandSyrian Arab RepublicTajikistanTanzaniaThailandTimor-LesteTogoTongaTrinidad and TobagoTunisiaTurkeyUgandaUkraineUnited KingdomUnited StatesUpper middle incomeUruguayVanuatuVenezuela, RBVietnamWest Bank and GazaWorldYemen, Rep.ZambiaZimbabwe Linea del tempo:
Questa scala temporale mostra un grafico dal 1975 anno al 2016 anno. Europe & Central Asia (excluding high income). I dati fino ad 1974 anno non disponibili. Il numero di osservazioni attuali secondo i date: 36.
La fonte (nome):
Indicatori dello sviluppo mondiale
La fonte (organizzazione):
World Bank national accounts data, and OECD National Accounts data files.
Categorie:
Economy & Growth
sono stati aggiornati
23 apr 2017 anni
Indicatori delle variazioni dei valori per anni
Minima:
12.879
1 gen 1980 anni
Massimo:
27.504
1 gen 1995 anni
Alla data di osservazione
Valore
Variazione assoluta
La variazione rispetto al valore precedente
1 gen 1975 anni
16.106
+16.106
0.0%
1 gen 1976 anni
14.881
-1.225
-7.61%
1 gen 1977 anni
16.345
+1.464
9.84%
1 gen 1978 anni
15.195
-1.149
-7.03%
1 gen 1979 anni
13.037
-2.158
-14.2%
1 gen 1980 anni
12.879
-0.158
-1.21%
1 gen 1981 anni
18.765
+5.886
45.7%
1 gen 1982 anni
19.782
+1.017
5.42%
1 gen 1983 anni
20.035
+0.253
1.28%
1 gen 1984 anni
17.421
-2.614
-13.05%
1 gen 1985 anni
18.663
+1.242
7.13%
1 gen 1986 anni
18.231
-0.432
-2.32%
1 gen 1987 anni
20.071
+1.84
10.09%
1 gen 1988 anni
25.955
+5.885
29.32%
1 gen 1995 anni
27.504
+1.549
5.97%
1 gen 1996 anni
24.986
-2.518
-9.16%
1 gen 1997 anni
23.031
-1.955
-7.83%
1 gen 1998 anni
20.766
-2.264
-9.83%
1 gen 1999 anni
20.056
-0.71
-3.42%
1 gen 2000 anni
22.378
+2.322
11.58%
1 gen 2001 anni
25.891
+3.513
15.7%
1 gen 2002 anni
25.968
+0.077
0.3%
1 gen 2003 anni
24.169
-1.798
-6.93%
1 gen 2004 anni
23.178
-0.991
-4.1%
1 gen 2005 anni
24.728
+1.549
6.68%
1 gen 2006 anni
25.16
+0.433
1.75%
1 gen 2007 anni
25.879
+0.718
2.85%
1 gen 2008 anni
24.923
-0.956
-3.69%
1 gen 2009 anni
26.834
+1.912
7.67%
1 gen 2010 anni
20.523
-6.311
-23.52%
1 gen 2011 anni
23.323
+2.799
13.64%
1 gen 2012 anni
24.741
+1.419
6.08%
1 gen 2013 anni
23.005
-1.737
-7.02%
1 gen 2014 anni
21.247
-1.758
-7.64%
1 gen 2015 anni
22.544
+1.297
6.11%
1 gen 2016 anni
22.281
-0.263
-1.17%
Classificazione dei paesi secondo i statistiche attuali per anni


Commenti: