29
/it/
it
AIzaSyAYiBZKx7MnpbEhh9jyipgxe19OcubqV5w
April 1, 2024
40280
IDA total
IDA
false
2
1
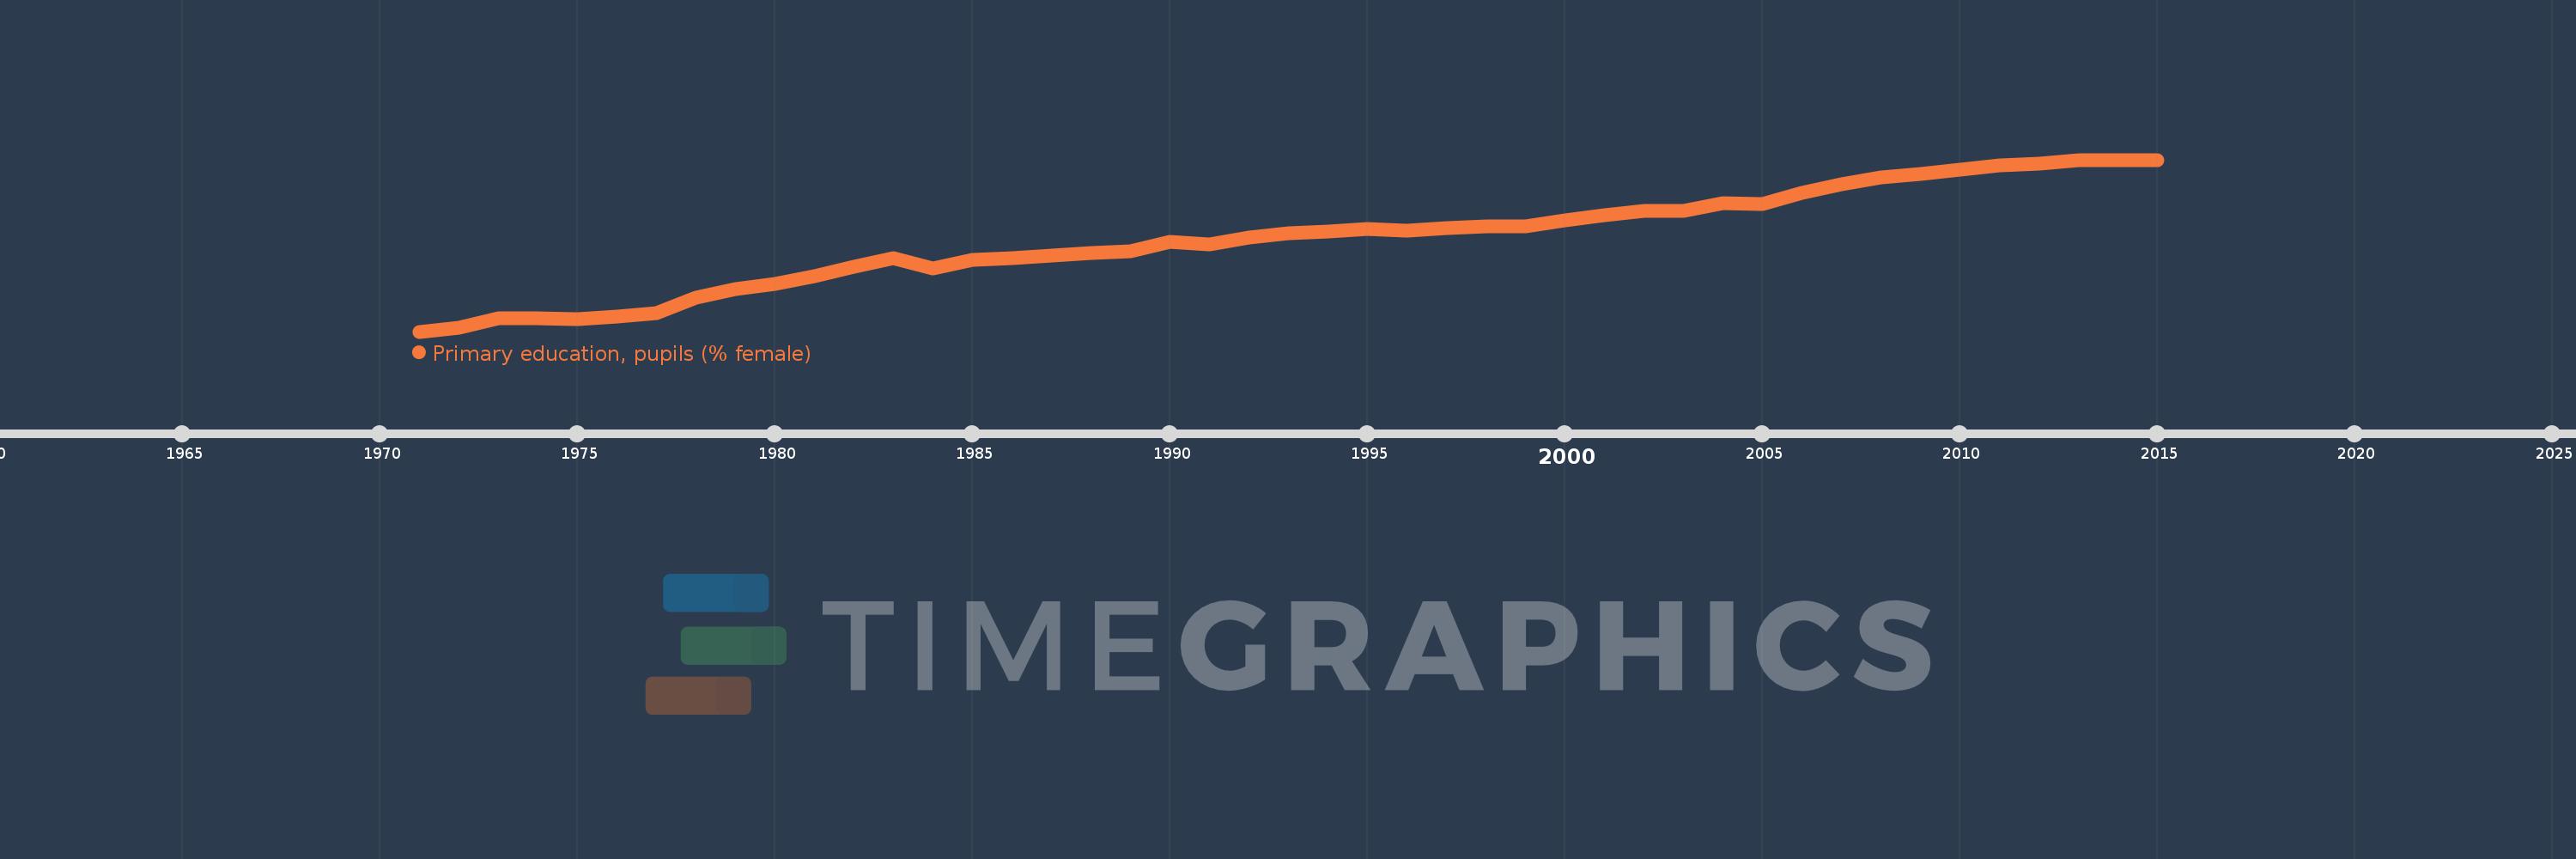
Primary education, pupils (% female)
2015,2014,2013,2012,2011,2010,2009,2008,2007,2006,2005,2004,2003,2002,2001,2000,1999,1998,1997,1996,1995,1994,1993,1992,1991,1990,1989,1988,1987,1986,1985,1984,1983,1982,1981,1980,1979,1978,1977,1976,1975,1974,1973,1972,1971
Queste statistiche in altri paesi:
AfghanistanAlbaniaAlgeriaAndorraAngolaAntigua and BarbudaArab WorldArgentinaArmeniaArubaAustraliaAustriaAzerbaijanBahamas, TheBahrainBangladeshBarbadosBelarusBelgiumBelizeBeninBermudaBhutanBoliviaBosnia and HerzegovinaBotswanaBrazilBritish Virgin IslandsBrunei DarussalamBulgariaBurkina FasoBurundiCabo VerdeCambodiaCameroonCanadaCaribbean small statesCayman IslandsCentral African RepublicCentral Europe and the BalticsChadChileChinaColombiaComorosCongo, Dem. Rep.Congo, Rep.Costa RicaCote d'IvoireCroatiaCubaCuracaoCyprusCzech RepublicDenmarkDjiboutiDominicaDominican RepublicEarly-demographic dividendEast Asia & PacificEast Asia & Pacific (excluding high income)East Asia & Pacific (IDA & IBRD countries)EcuadorEgypt, Arab Rep.El SalvadorEquatorial GuineaEritreaEstoniaEthiopiaEuro areaEurope & Central AsiaEurope & Central Asia (excluding high income)Europe & Central Asia (IDA & IBRD countries)European UnionFijiFinlandFragile and conflict affected situationsFranceGabonGambia, TheGeorgiaGermanyGhanaGibraltarGreeceGrenadaGuatemalaGuineaGuinea-BissauGuyanaHaitiHeavily indebted poor countries (HIPC)High incomeHondurasHong Kong SAR, ChinaHungaryIBRD onlyIcelandIDA & IBRD totalIDA blendIDA onlyIDA totalIndiaIndonesiaIran, Islamic Rep.IraqIrelandIsraelItalyJamaicaJapanJordanKazakhstanKenyaKiribatiKorea, Dem. People’s Rep.Korea, Rep.KuwaitKyrgyz RepublicLao PDRLate-demographic dividendLatin America & Caribbean Latin America & Caribbean (excluding high income)Latin America & the Caribbean (IDA & IBRD countries)LatviaLeast developed countries: UN classificationLebanonLesothoLiberiaLibyaLiechtensteinLithuaniaLow & middle incomeLow incomeLower middle incomeLuxembourgMacao SAR, ChinaMacedonia, FYRMadagascarMalawiMalaysiaMaldivesMaliMaltaMarshall IslandsMauritaniaMauritiusMexicoMicronesia, Fed. Sts.Middle East & North AfricaMiddle East & North Africa (excluding high income)Middle East & North Africa (IDA & IBRD countries)Middle incomeMoldovaMonacoMongoliaMontenegroMoroccoMozambiqueMyanmarNamibiaNauruNepalNetherlandsNew ZealandNicaraguaNigerNigeriaNorth AmericaNorwayOECD membersOmanOther small statesPacific island small statesPakistanPalauPanamaPapua New GuineaParaguayPeruPhilippinesPolandPortugalPost-demographic dividendPre-demographic dividendPuerto RicoQatarRomaniaRussian FederationRwandaSamoaSan MarinoSao Tome and PrincipeSaudi ArabiaSenegalSerbiaSeychellesSierra LeoneSingaporeSint Maarten (Dutch part)Slovak RepublicSloveniaSmall statesSolomon IslandsSomaliaSouth AfricaSouth AsiaSouth Asia (IDA & IBRD)South SudanSpainSri LankaSt. Kitts and NevisSt. LuciaSt. Vincent and the GrenadinesSub-Saharan Africa Sub-Saharan Africa (excluding high income)Sub-Saharan Africa (IDA & IBRD countries)SudanSurinameSwazilandSwedenSwitzerlandSyrian Arab RepublicTajikistanTanzaniaThailandTimor-LesteTogoTongaTrinidad and TobagoTunisiaTurkeyTurkmenistanTurks and Caicos IslandsTuvaluUgandaUkraineUnited Arab EmiratesUnited KingdomUnited StatesUpper middle incomeUruguayUzbekistanVanuatuVenezuela, RBVietnamWest Bank and GazaWorldYemen, Rep.ZambiaZimbabwe Linea del tempo:
Questa scala temporale mostra un grafico dal 1971 anno al 2015 anno. IDA total. I dati fino ad 1970 anno non disponibili. Il numero di osservazioni attuali secondo i date: 45.
La fonte (nome):
Indicatori dello sviluppo mondiale
La fonte (organizzazione):
United Nations Educational, Scientific, and Cultural Organization (UNESCO) Institute for Statistics.
Categorie:
Education, Gender
sono stati aggiornati
23 apr 2017 anni
Indicatori delle variazioni dei valori per anni
Minima:
40.027
1 gen 1971 anni
Massimo:
47.663
1 gen 2014 anni
Alla data di osservazione
Valore
Variazione assoluta
La variazione rispetto al valore precedente
1 gen 1971 anni
40.027
+40.027
0.0%
1 gen 1972 anni
40.209
+0.182
0.46%
1 gen 1973 anni
40.622
+0.413
1.03%
1 gen 1974 anni
40.601
-0.021
-0.05%
1 gen 1975 anni
40.562
-0.039
-0.09%
1 gen 1976 anni
40.7
+0.138
0.34%
1 gen 1977 anni
40.86
+0.16
0.39%
1 gen 1978 anni
41.554
+0.694
1.7%
1 gen 1979 anni
41.924
+0.37
0.89%
1 gen 1980 anni
42.143
+0.219
0.52%
1 gen 1981 anni
42.481
+0.338
0.8%
1 gen 1982 anni
42.911
+0.43
1.01%
1 gen 1983 anni
43.274
+0.363
0.85%
1 gen 1984 anni
42.828
-0.446
-1.03%
1 gen 1985 anni
43.232
+0.403
0.94%
1 gen 1986 anni
43.283
+0.052
0.12%
1 gen 1987 anni
43.393
+0.109
0.25%
1 gen 1988 anni
43.53
+0.138
0.32%
1 gen 1989 anni
43.589
+0.059
0.14%
1 gen 1990 anni
44.001
+0.412
0.94%
1 gen 1991 anni
43.92
-0.081
-0.18%
1 gen 1992 anni
44.226
+0.306
0.7%
1 gen 1993 anni
44.406
+0.18
0.41%
1 gen 1994 anni
44.456
+0.05
0.11%
1 gen 1995 anni
44.592
+0.137
0.31%
1 gen 1996 anni
44.526
-0.067
-0.15%
1 gen 1997 anni
44.621
+0.095
0.21%
1 gen 1998 anni
44.685
+0.064
0.14%
1 gen 1999 anni
44.723
+0.037
0.08%
1 gen 2000 anni
44.954
+0.232
0.52%
1 gen 2001 anni
45.207
+0.252
0.56%
1 gen 2002 anni
45.394
+0.187
0.41%
1 gen 2003 anni
45.402
+0.008
0.02%
1 gen 2004 anni
45.74
+0.338
0.75%
1 gen 2005 anni
45.712
-0.028
-0.06%
1 gen 2006 anni
46.189
+0.477
1.04%
1 gen 2007 anni
46.576
+0.387
0.84%
1 gen 2008 anni
46.886
+0.309
0.66%
1 gen 2009 anni
47.049
+0.164
0.35%
1 gen 2010 anni
47.243
+0.194
0.41%
1 gen 2011 anni
47.41
+0.167
0.35%
1 gen 2012 anni
47.508
+0.098
0.21%
1 gen 2013 anni
47.654
+0.147
0.31%
1 gen 2014 anni
47.663
+0.009
0.02%
1 gen 2015 anni
47.631
-0.033
-0.07%
Classificazione dei paesi secondo i statistiche attuali per anni


Commenti: