29
/it/
it
AIzaSyAYiBZKx7MnpbEhh9jyipgxe19OcubqV5w
April 1, 2024
37726
IDA & IBRD total
IBT
false
2
1
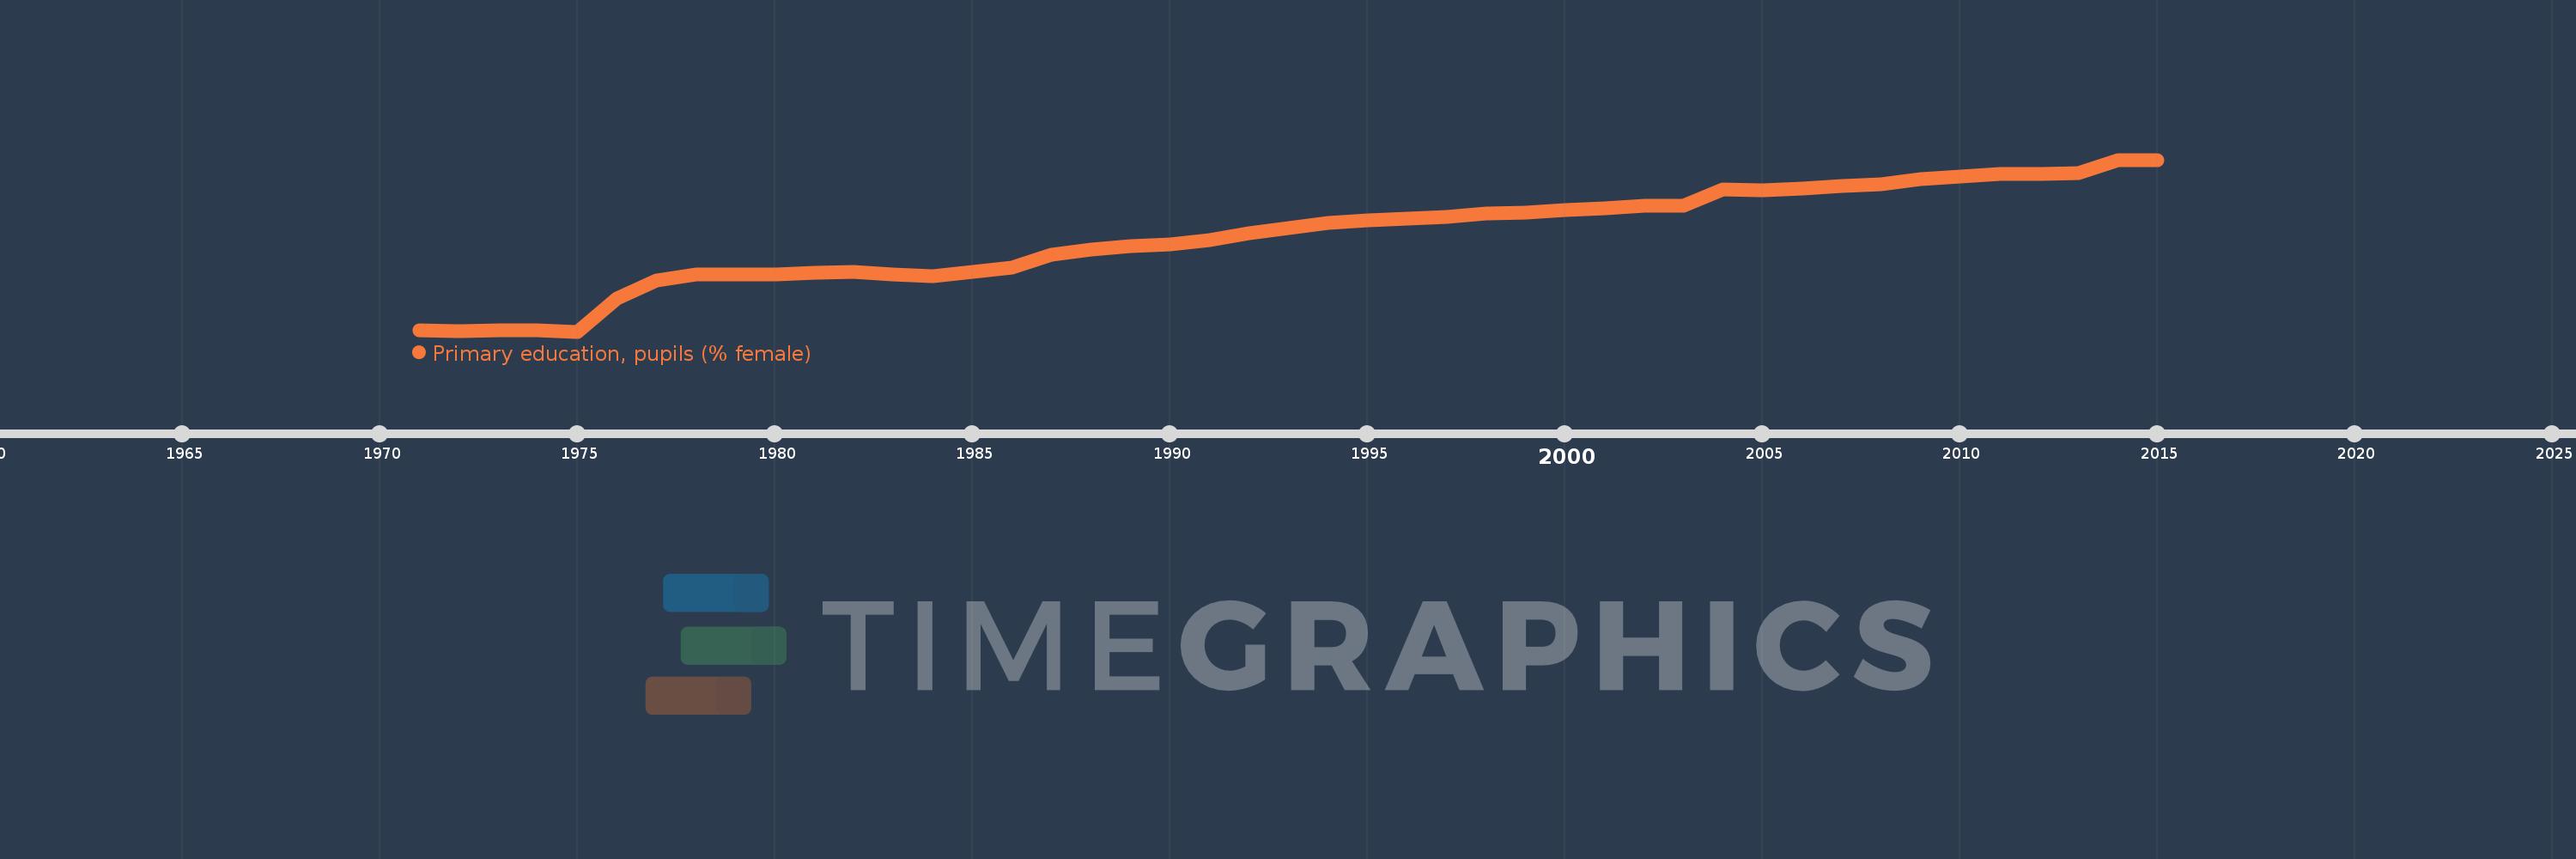
Primary education, pupils (% female)
2015,2014,2013,2012,2011,2010,2009,2008,2007,2006,2005,2004,2003,2002,2001,2000,1999,1998,1997,1996,1995,1994,1993,1992,1991,1990,1989,1988,1987,1986,1985,1984,1983,1982,1981,1980,1979,1978,1977,1976,1975,1974,1973,1972,1971
Queste statistiche in altri paesi:
AfghanistanAlbaniaAlgeriaAndorraAngolaAntigua and BarbudaArab WorldArgentinaArmeniaArubaAustraliaAustriaAzerbaijanBahamas, TheBahrainBangladeshBarbadosBelarusBelgiumBelizeBeninBermudaBhutanBoliviaBosnia and HerzegovinaBotswanaBrazilBritish Virgin IslandsBrunei DarussalamBulgariaBurkina FasoBurundiCabo VerdeCambodiaCameroonCanadaCaribbean small statesCayman IslandsCentral African RepublicCentral Europe and the BalticsChadChileChinaColombiaComorosCongo, Dem. Rep.Congo, Rep.Costa RicaCote d'IvoireCroatiaCubaCuracaoCyprusCzech RepublicDenmarkDjiboutiDominicaDominican RepublicEarly-demographic dividendEast Asia & PacificEast Asia & Pacific (excluding high income)East Asia & Pacific (IDA & IBRD countries)EcuadorEgypt, Arab Rep.El SalvadorEquatorial GuineaEritreaEstoniaEthiopiaEuro areaEurope & Central AsiaEurope & Central Asia (excluding high income)Europe & Central Asia (IDA & IBRD countries)European UnionFijiFinlandFragile and conflict affected situationsFranceGabonGambia, TheGeorgiaGermanyGhanaGibraltarGreeceGrenadaGuatemalaGuineaGuinea-BissauGuyanaHaitiHeavily indebted poor countries (HIPC)High incomeHondurasHong Kong SAR, ChinaHungaryIBRD onlyIcelandIDA & IBRD totalIDA blendIDA onlyIDA totalIndiaIndonesiaIran, Islamic Rep.IraqIrelandIsraelItalyJamaicaJapanJordanKazakhstanKenyaKiribatiKorea, Dem. People’s Rep.Korea, Rep.KuwaitKyrgyz RepublicLao PDRLate-demographic dividendLatin America & Caribbean Latin America & Caribbean (excluding high income)Latin America & the Caribbean (IDA & IBRD countries)LatviaLeast developed countries: UN classificationLebanonLesothoLiberiaLibyaLiechtensteinLithuaniaLow & middle incomeLow incomeLower middle incomeLuxembourgMacao SAR, ChinaMacedonia, FYRMadagascarMalawiMalaysiaMaldivesMaliMaltaMarshall IslandsMauritaniaMauritiusMexicoMicronesia, Fed. Sts.Middle East & North AfricaMiddle East & North Africa (excluding high income)Middle East & North Africa (IDA & IBRD countries)Middle incomeMoldovaMonacoMongoliaMontenegroMoroccoMozambiqueMyanmarNamibiaNauruNepalNetherlandsNew ZealandNicaraguaNigerNigeriaNorth AmericaNorwayOECD membersOmanOther small statesPacific island small statesPakistanPalauPanamaPapua New GuineaParaguayPeruPhilippinesPolandPortugalPost-demographic dividendPre-demographic dividendPuerto RicoQatarRomaniaRussian FederationRwandaSamoaSan MarinoSao Tome and PrincipeSaudi ArabiaSenegalSerbiaSeychellesSierra LeoneSingaporeSint Maarten (Dutch part)Slovak RepublicSloveniaSmall statesSolomon IslandsSomaliaSouth AfricaSouth AsiaSouth Asia (IDA & IBRD)South SudanSpainSri LankaSt. Kitts and NevisSt. LuciaSt. Vincent and the GrenadinesSub-Saharan Africa Sub-Saharan Africa (excluding high income)Sub-Saharan Africa (IDA & IBRD countries)SudanSurinameSwazilandSwedenSwitzerlandSyrian Arab RepublicTajikistanTanzaniaThailandTimor-LesteTogoTongaTrinidad and TobagoTunisiaTurkeyTurkmenistanTurks and Caicos IslandsTuvaluUgandaUkraineUnited Arab EmiratesUnited KingdomUnited StatesUpper middle incomeUruguayUzbekistanVanuatuVenezuela, RBVietnamWest Bank and GazaWorldYemen, Rep.ZambiaZimbabwe Linea del tempo:
Questa scala temporale mostra un grafico dal 1971 anno al 2015 anno. IDA & IBRD total. I dati fino ad 1970 anno non disponibili. Il numero di osservazioni attuali secondo i date: 45.
La fonte (nome):
Indicatori dello sviluppo mondiale
La fonte (organizzazione):
United Nations Educational, Scientific, and Cultural Organization (UNESCO) Institute for Statistics.
Categorie:
Education, Gender
sono stati aggiornati
23 apr 2017 anni
Indicatori delle variazioni dei valori per anni
Minima:
42.062
1 gen 1975 anni
Massimo:
48.055
1 gen 2014 anni
Alla data di osservazione
Valore
Variazione assoluta
La variazione rispetto al valore precedente
1 gen 1971 anni
42.106
+42.106
0.0%
1 gen 1972 anni
42.09
-0.016
-0.04%
1 gen 1973 anni
42.121
+0.032
0.08%
1 gen 1974 anni
42.101
-0.021
-0.05%
1 gen 1975 anni
42.062
-0.039
-0.09%
1 gen 1976 anni
43.207
+1.146
2.72%
1 gen 1977 anni
43.848
+0.64
1.48%
1 gen 1978 anni
44.054
+0.206
0.47%
1 gen 1979 anni
44.048
-0.006
-0.01%
1 gen 1980 anni
44.064
+0.016
0.04%
1 gen 1981 anni
44.125
+0.061
0.14%
1 gen 1982 anni
44.138
+0.013
0.03%
1 gen 1983 anni
44.067
-0.071
-0.16%
1 gen 1984 anni
43.981
-0.087
-0.2%
1 gen 1985 anni
44.131
+0.15
0.34%
1 gen 1986 anni
44.3
+0.169
0.38%
1 gen 1987 anni
44.748
+0.448
1.01%
1 gen 1988 anni
44.938
+0.19
0.43%
1 gen 1989 anni
45.044
+0.107
0.24%
1 gen 1990 anni
45.098
+0.053
0.12%
1 gen 1991 anni
45.24
+0.142
0.32%
1 gen 1992 anni
45.496
+0.255
0.56%
1 gen 1993 anni
45.677
+0.181
0.4%
1 gen 1994 anni
45.84
+0.163
0.36%
1 gen 1995 anni
45.944
+0.104
0.23%
1 gen 1996 anni
46.002
+0.058
0.13%
1 gen 1997 anni
46.06
+0.059
0.13%
1 gen 1998 anni
46.191
+0.13
0.28%
1 gen 1999 anni
46.226
+0.036
0.08%
1 gen 2000 anni
46.314
+0.088
0.19%
1 gen 2001 anni
46.357
+0.042
0.09%
1 gen 2002 anni
46.444
+0.087
0.19%
1 gen 2003 anni
46.452
+0.008
0.02%
1 gen 2004 anni
47.016
+0.564
1.22%
1 gen 2005 anni
46.978
-0.038
-0.08%
1 gen 2006 anni
47.049
+0.072
0.15%
1 gen 2007 anni
47.13
+0.08
0.17%
1 gen 2008 anni
47.194
+0.064
0.14%
1 gen 2009 anni
47.384
+0.19
0.4%
1 gen 2010 anni
47.483
+0.099
0.21%
1 gen 2011 anni
47.55
+0.067
0.14%
1 gen 2012 anni
47.558
+0.008
0.02%
1 gen 2013 anni
47.596
+0.038
0.08%
1 gen 2014 anni
48.055
+0.459
0.96%
1 gen 2015 anni
48.038
-0.017
-0.04%
Classificazione dei paesi secondo i statistiche attuali per anni


Commenti: