29
/it/
it
AIzaSyAYiBZKx7MnpbEhh9jyipgxe19OcubqV5w
April 1, 2024
39618
IDA only
IDX
false
2
1
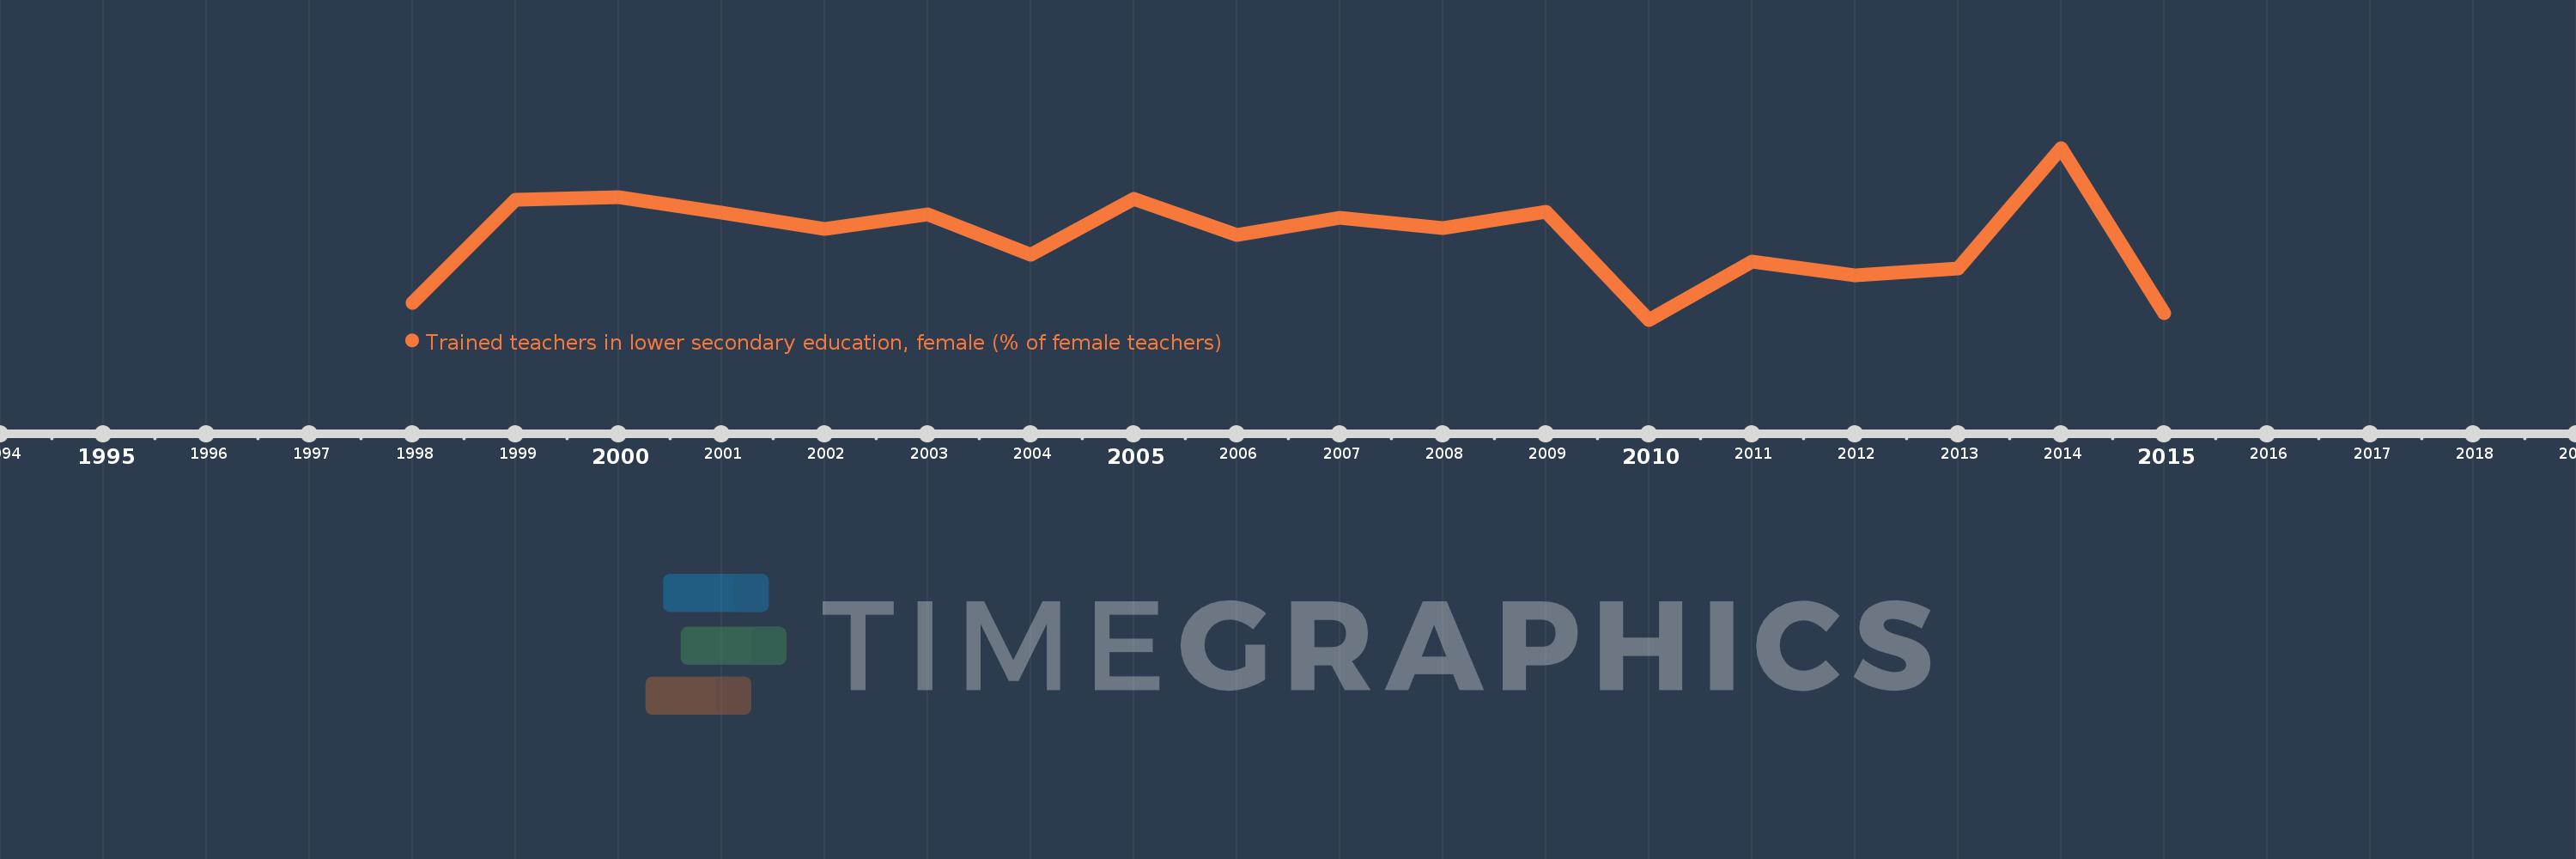
Trained teachers in lower secondary education, female (% of female teachers)
2015,2014,2013,2012,2011,2010,2009,2008,2007,2006,2005,2004,2003,2002,2001,2000,1999,1998
Queste statistiche in altri paesi:
Linea del tempo:
Questa scala temporale mostra un grafico dal 1998 anno al 2015 anno. IDA only. I dati fino ad 1997 anno non disponibili. Il numero di osservazioni attuali secondo i date: 18.
La fonte (nome):
Indicatori dello sviluppo mondiale
La fonte (organizzazione):
United Nations Educational, Scientific, and Cultural Organization (UNESCO) Institute for Statistics.
Categorie:
Education
sono stati aggiornati
23 apr 2017 anni
Indicatori delle variazioni dei valori per anni
Minima:
68.611
1 gen 2010 anni
Massimo:
84.885
1 gen 2014 anni
Alla data di osservazione
Valore
Variazione assoluta
La variazione rispetto al valore precedente
1 gen 1998 anni
70.19
+70.19
0.0%
1 gen 1999 anni
79.942
+9.752
13.89%
1 gen 2000 anni
80.211
+0.269
0.34%
1 gen 2001 anni
78.743
-1.469
-1.83%
1 gen 2002 anni
77.243
-1.5
-1.9%
1 gen 2003 anni
78.599
+1.356
1.76%
1 gen 2004 anni
74.752
-3.847
-4.89%
1 gen 2005 anni
80.037
+5.284
7.07%
1 gen 2006 anni
76.651
-3.386
-4.23%
1 gen 2007 anni
78.256
+1.605
2.09%
1 gen 2008 anni
77.316
-0.94
-1.2%
1 gen 2009 anni
78.84
+1.524
1.97%
1 gen 2010 anni
68.611
-10.229
-12.97%
1 gen 2011 anni
74.145
+5.534
8.07%
1 gen 2012 anni
72.814
-1.33
-1.79%
1 gen 2013 anni
73.49
+0.676
0.93%
1 gen 2014 anni
84.885
+11.395
15.5%
1 gen 2015 anni
69.258
-15.627
-18.41%
Classificazione dei paesi secondo i statistiche attuali per anni


Commenti: