29
/it/
it
AIzaSyAYiBZKx7MnpbEhh9jyipgxe19OcubqV5w
April 1, 2024
141227
Ghana
GHA
true
2
1
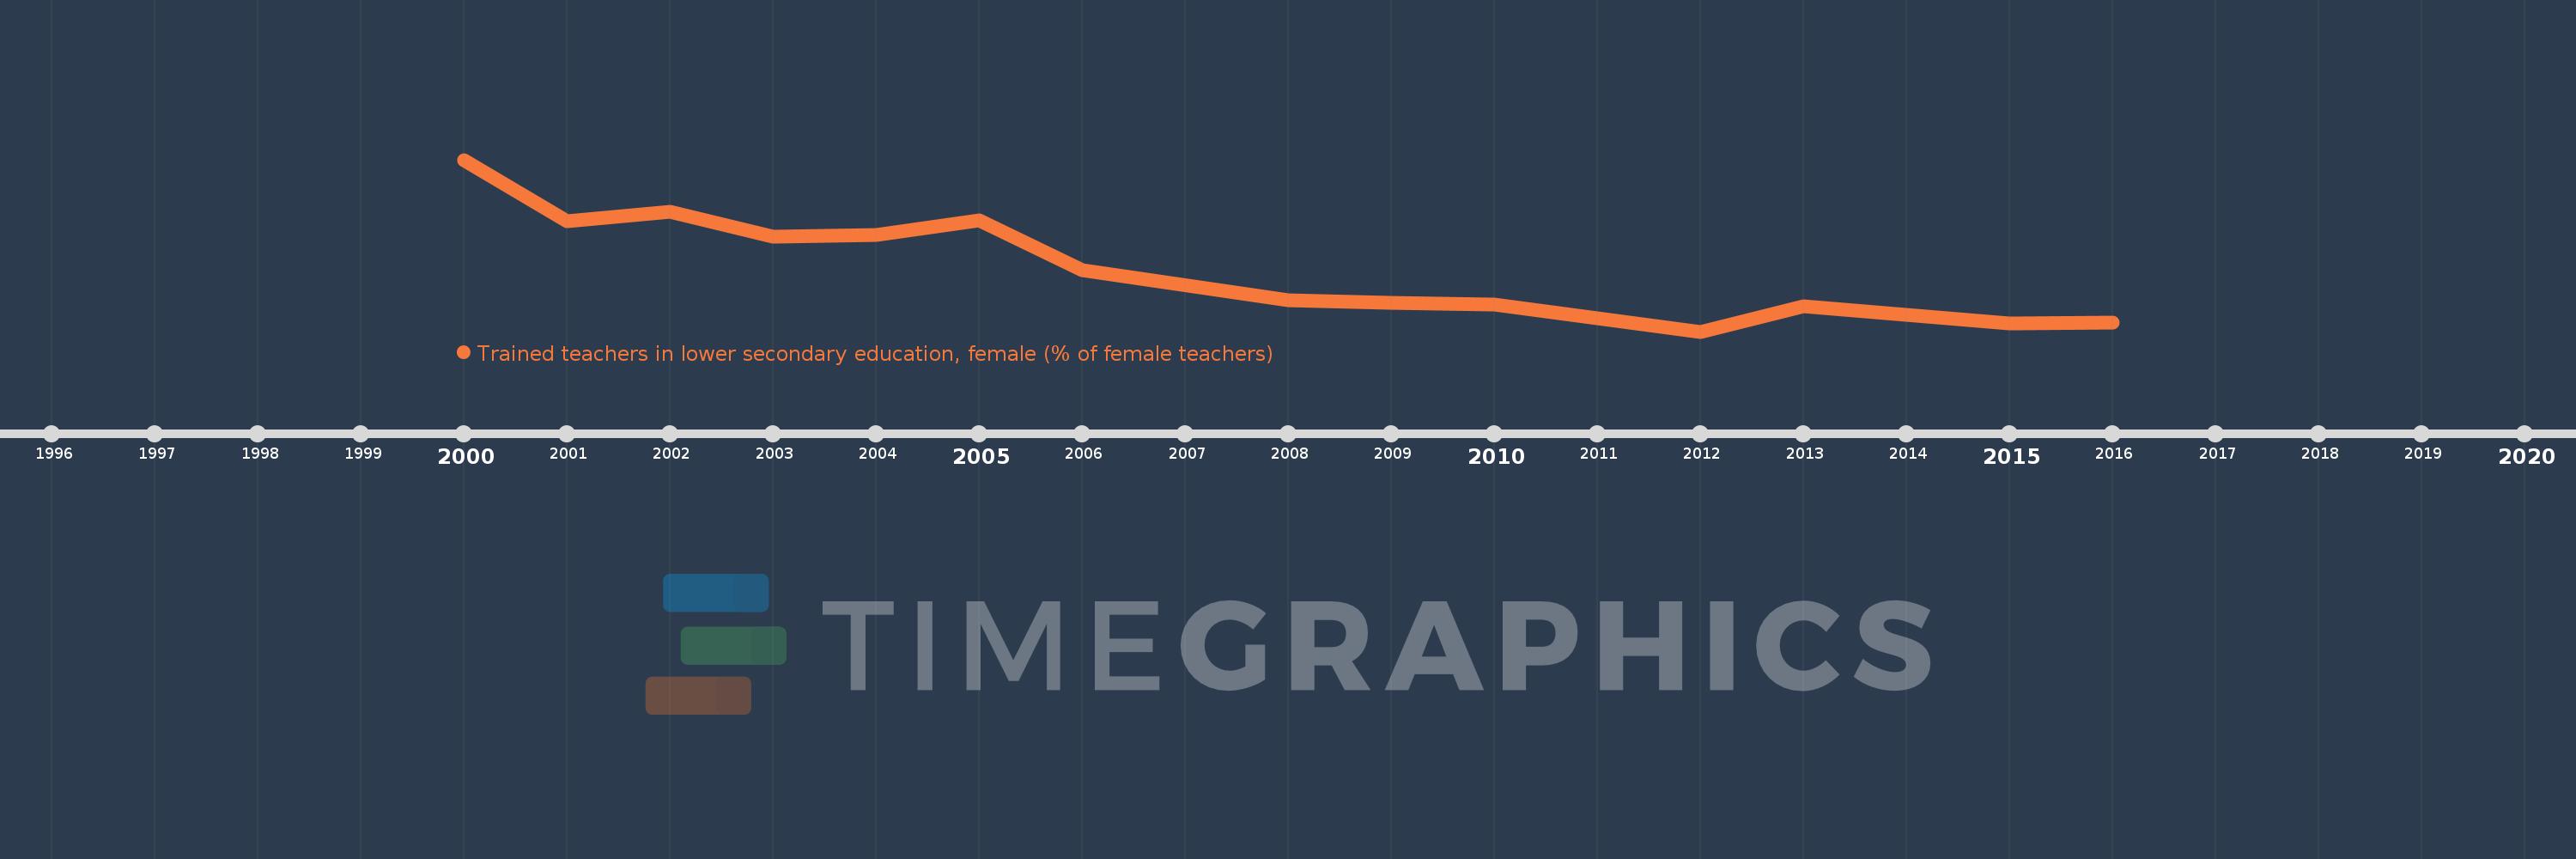
Trained teachers in lower secondary education, female (% of female teachers)
2016,2015,2014,2013,2012,2010,2009,2008,2006,2005,2004,2003,2002,2001,2000
Queste statistiche in altri paesi:
Linea del tempo:
Questa scala temporale mostra un grafico dal 2000 anno al 2016 anno. Ghana. I dati fino ad 1999 anno non disponibili. Il numero di osservazioni attuali secondo i date: 15.
La fonte (nome):
Indicatori dello sviluppo mondiale
La fonte (organizzazione):
United Nations Educational, Scientific, and Cultural Organization (UNESCO) Institute for Statistics.
Categorie:
Education
sono stati aggiornati
23 apr 2017 anni
Indicatori delle variazioni dei valori per anni
Minima:
80.363
1 gen 2012 anni
Massimo:
97.436
1 gen 2000 anni
Alla data di osservazione
Valore
Variazione assoluta
La variazione rispetto al valore precedente
1 gen 2000 anni
97.436
+97.436
0.0%
1 gen 2001 anni
91.339
-6.097
-6.26%
1 gen 2002 anni
92.236
+0.897
0.98%
1 gen 2003 anni
89.766
-2.47
-2.68%
1 gen 2004 anni
89.989
+0.223
0.25%
1 gen 2005 anni
91.454
+1.465
1.63%
1 gen 2006 anni
86.449
-5.005
-5.47%
1 gen 2008 anni
83.452
-2.997
-3.47%
1 gen 2009 anni
83.187
-0.265
-0.32%
1 gen 2010 anni
83.035
-0.151
-0.18%
1 gen 2012 anni
80.363
-2.673
-3.22%
1 gen 2013 anni
82.896
+2.533
3.15%
1 gen 2014 anni
82.011
-0.885
-1.07%
1 gen 2015 anni
81.197
-0.814
-0.99%
1 gen 2016 anni
81.242
+0.045
0.06%
Classificazione dei paesi secondo i statistiche attuali per anni


Commenti: