29
/it/
it
AIzaSyAYiBZKx7MnpbEhh9jyipgxe19OcubqV5w
April 1, 2024
38580
IDA blend
IDB
false
2
1
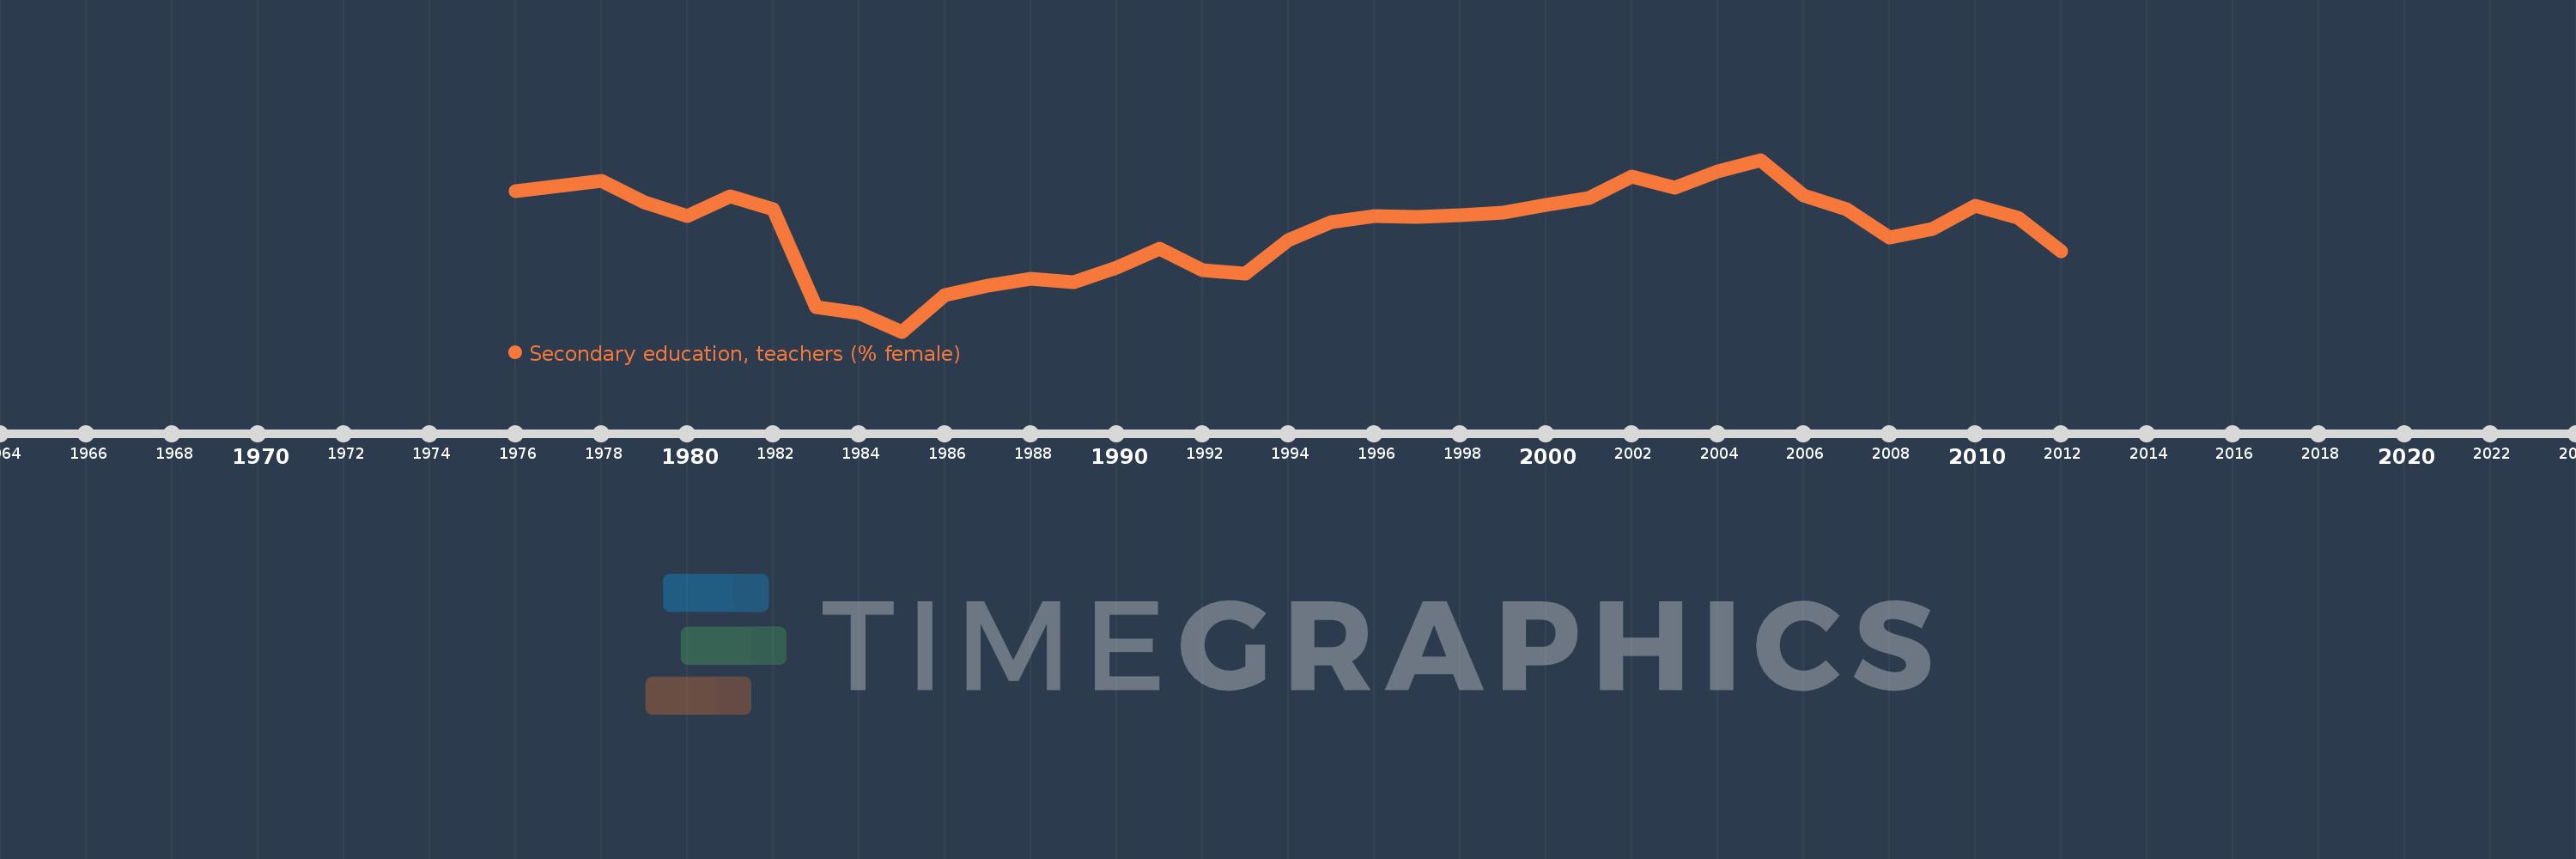
Secondary education, teachers (% female)
2012,2011,2010,2009,2008,2007,2006,2005,2004,2003,2002,2001,2000,1999,1998,1997,1996,1995,1994,1993,1992,1991,1990,1989,1988,1987,1986,1985,1984,1983,1982,1981,1980,1979,1978,1977,1976
Queste statistiche in altri paesi:
AfghanistanAlbaniaAlgeriaAndorraAngolaAntigua and BarbudaArab WorldArgentinaArmeniaArubaAustraliaAustriaBahamas, TheBahrainBangladeshBarbadosBelarusBelgiumBelizeBeninBermudaBhutanBoliviaBosnia and HerzegovinaBotswanaBrazilBritish Virgin IslandsBrunei DarussalamBulgariaBurkina FasoBurundiCabo VerdeCambodiaCameroonCanadaCaribbean small statesCayman IslandsCentral African RepublicCentral Europe and the BalticsChadChileChinaColombiaComorosCongo, Dem. Rep.Congo, Rep.Costa RicaCote d'IvoireCroatiaCubaCyprusCzech RepublicDenmarkDjiboutiDominicaDominican RepublicEarly-demographic dividendEast Asia & PacificEast Asia & Pacific (excluding high income)East Asia & Pacific (IDA & IBRD countries)EcuadorEgypt, Arab Rep.El SalvadorEquatorial GuineaEritreaEstoniaEthiopiaEuro areaEurope & Central AsiaEurope & Central Asia (excluding high income)Europe & Central Asia (IDA & IBRD countries)European UnionFijiFinlandFragile and conflict affected situationsFranceGabonGambia, TheGeorgiaGermanyGhanaGibraltarGreeceGrenadaGuatemalaGuineaGuinea-BissauGuyanaHeavily indebted poor countries (HIPC)High incomeHondurasHong Kong SAR, ChinaHungaryIBRD onlyIcelandIDA & IBRD totalIDA blendIDA onlyIDA totalIndiaIndonesiaIran, Islamic Rep.IraqIrelandIsraelItalyJamaicaJapanJordanKazakhstanKenyaKiribatiKorea, Dem. People’s Rep.Korea, Rep.KuwaitKyrgyz RepublicLao PDRLate-demographic dividendLatin America & Caribbean Latin America & Caribbean (excluding high income)Latin America & the Caribbean (IDA & IBRD countries)LatviaLeast developed countries: UN classificationLebanonLesothoLiberiaLibyaLiechtensteinLithuaniaLow & middle incomeLow incomeLower middle incomeLuxembourgMacao SAR, ChinaMacedonia, FYRMadagascarMalawiMalaysiaMaldivesMaliMaltaMarshall IslandsMauritaniaMauritiusMexicoMiddle East & North AfricaMiddle East & North Africa (excluding high income)Middle East & North Africa (IDA & IBRD countries)Middle incomeMoldovaMonacoMongoliaMoroccoMozambiqueMyanmarNamibiaNauruNepalNetherlandsNew ZealandNicaraguaNigerNigeriaNorth AmericaNorwayOECD membersOmanOther small statesPacific island small statesPakistanPalauPanamaPapua New GuineaParaguayPeruPhilippinesPolandPortugalPost-demographic dividendPre-demographic dividendPuerto RicoQatarRomaniaRussian FederationRwandaSamoaSan MarinoSao Tome and PrincipeSaudi ArabiaSenegalSerbiaSeychellesSierra LeoneSingaporeSint Maarten (Dutch part)Slovak RepublicSloveniaSmall statesSolomon IslandsSomaliaSouth AfricaSouth AsiaSouth Asia (IDA & IBRD)SpainSri LankaSt. Kitts and NevisSt. LuciaSt. Vincent and the GrenadinesSub-Saharan Africa Sub-Saharan Africa (excluding high income)Sub-Saharan Africa (IDA & IBRD countries)SudanSurinameSwazilandSwedenSwitzerlandSyrian Arab RepublicTajikistanTanzaniaThailandTimor-LesteTogoTongaTrinidad and TobagoTunisiaTurkeyTurks and Caicos IslandsUgandaUkraineUnited Arab EmiratesUnited KingdomUnited StatesUpper middle incomeUruguayUzbekistanVanuatuVenezuela, RBVietnamWest Bank and GazaWorldYemen, Rep.ZambiaZimbabwe Linea del tempo:
Questa scala temporale mostra un grafico dal 1976 anno al 2012 anno. IDA blend. I dati fino ad 1975 anno non disponibili. Il numero di osservazioni attuali secondo i date: 37.
La fonte (nome):
Indicatori dello sviluppo mondiale
La fonte (organizzazione):
United Nations Educational, Scientific, and Cultural Organization (UNESCO) Institute for Statistics.
Categorie:
Education, Gender
sono stati aggiornati
23 apr 2017 anni
Indicatori delle variazioni dei valori per anni
Minima:
47.282
1 gen 1985 anni
Massimo:
51.136
1 gen 2005 anni
Alla data di osservazione
Valore
Variazione assoluta
La variazione rispetto al valore precedente
1 gen 1976 anni
50.428
+50.428
0.0%
1 gen 1977 anni
50.546
+0.117
0.23%
1 gen 1978 anni
50.662
+0.116
0.23%
1 gen 1979 anni
50.189
-0.473
-0.93%
1 gen 1980 anni
49.874
-0.315
-0.63%
1 gen 1981 anni
50.316
+0.442
0.89%
1 gen 1982 anni
50.032
-0.283
-0.56%
1 gen 1983 anni
47.822
-2.211
-4.42%
1 gen 1984 anni
47.7
-0.122
-0.26%
1 gen 1985 anni
47.282
-0.418
-0.88%
1 gen 1986 anni
48.104
+0.823
1.74%
1 gen 1987 anni
48.307
+0.203
0.42%
1 gen 1988 anni
48.46
+0.152
0.31%
1 gen 1989 anni
48.383
-0.077
-0.16%
1 gen 1990 anni
48.712
+0.329
0.68%
1 gen 1991 anni
49.141
+0.429
0.88%
1 gen 1992 anni
48.665
-0.476
-0.97%
1 gen 1993 anni
48.58
-0.084
-0.17%
1 gen 1994 anni
49.331
+0.751
1.55%
1 gen 1995 anni
49.741
+0.41
0.83%
1 gen 1996 anni
49.874
+0.133
0.27%
1 gen 1997 anni
49.864
-0.01
-0.02%
1 gen 1998 anni
49.889
+0.025
0.05%
1 gen 1999 anni
49.943
+0.054
0.11%
1 gen 2000 anni
50.117
+0.174
0.35%
1 gen 2001 anni
50.274
+0.157
0.31%
1 gen 2002 anni
50.769
+0.495
0.98%
1 gen 2003 anni
50.511
-0.258
-0.51%
1 gen 2004 anni
50.879
+0.369
0.73%
1 gen 2005 anni
51.136
+0.256
0.5%
1 gen 2006 anni
50.329
-0.807
-1.58%
1 gen 2007 anni
50.031
-0.297
-0.59%
1 gen 2008 anni
49.385
-0.646
-1.29%
1 gen 2009 anni
49.592
+0.207
0.42%
1 gen 2010 anni
50.101
+0.509
1.03%
1 gen 2011 anni
49.828
-0.273
-0.54%
1 gen 2012 anni
49.091
-0.737
-1.48%
Classificazione dei paesi secondo i statistiche attuali per anni


Commenti: